Fig. 4
Download original image
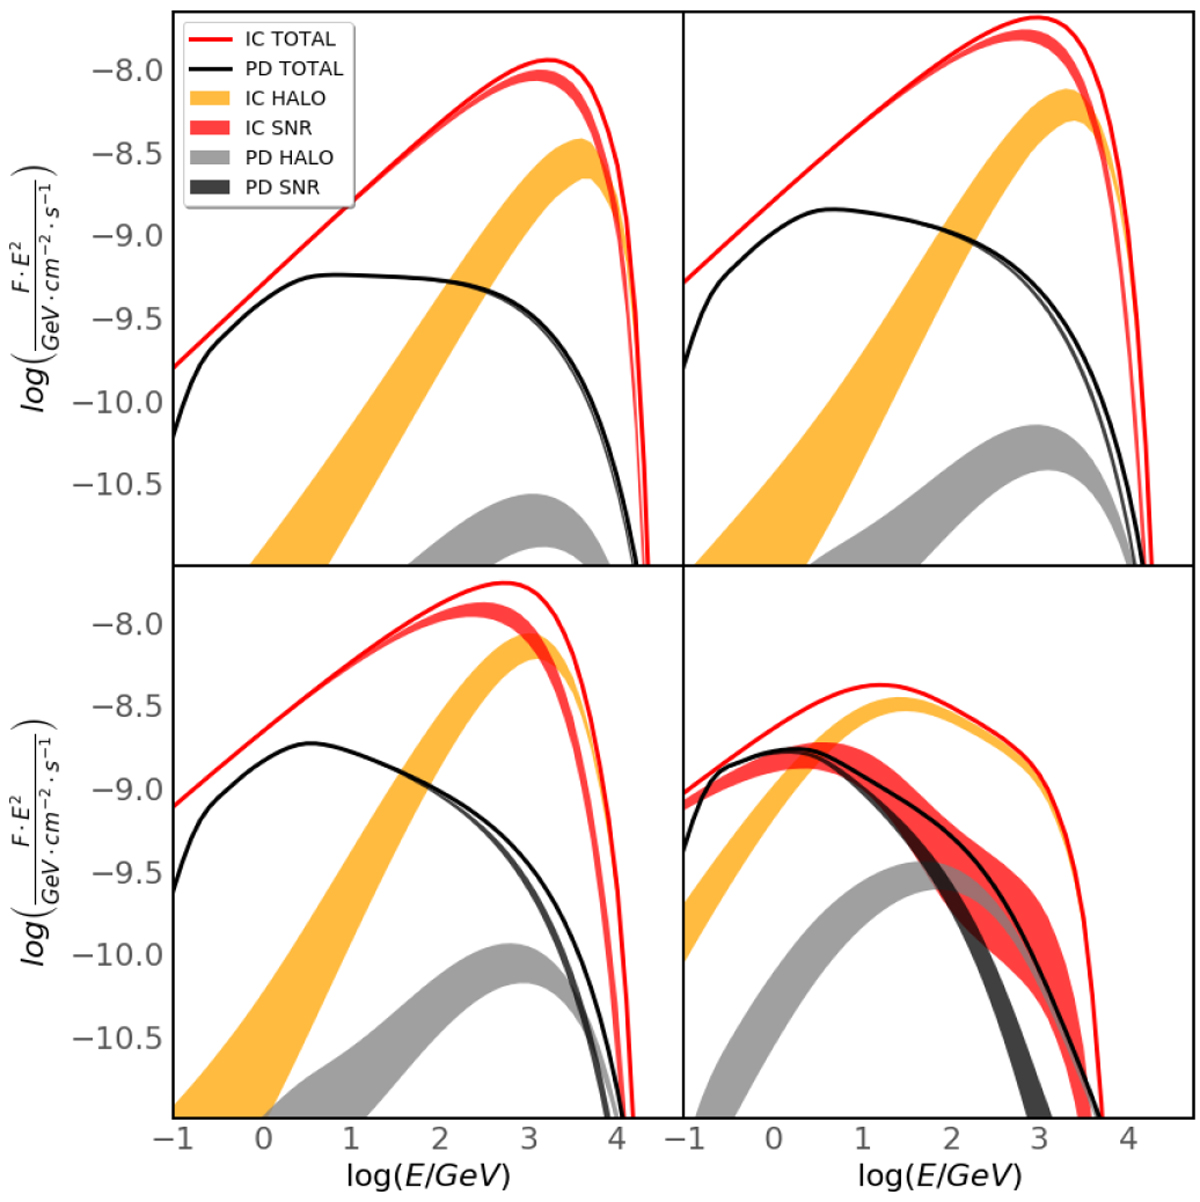
Comparison of emission spectra for IC (red) and PD (black) emission. Emission from the SNR is filled-black and filled-red forPD and IC-emission respectively. The halo-emission is filled-orange and filled-gray for IC and PD-emission respectively at 300, 1000, 2000 and 10 000 yr (from top left to bottom right). The spectra including (and excluding) the projection effect constitute the upper (lower) boundaries of the SNR emission and the lower (upper) limit of the area for emission from the halo.
Current usage metrics show cumulative count of Article Views (full-text article views including HTML views, PDF and ePub downloads, according to the available data) and Abstracts Views on Vision4Press platform.
Data correspond to usage on the plateform after 2015. The current usage metrics is available 48-96 hours after online publication and is updated daily on week days.
Initial download of the metrics may take a while.