Fig. 1
Download original image
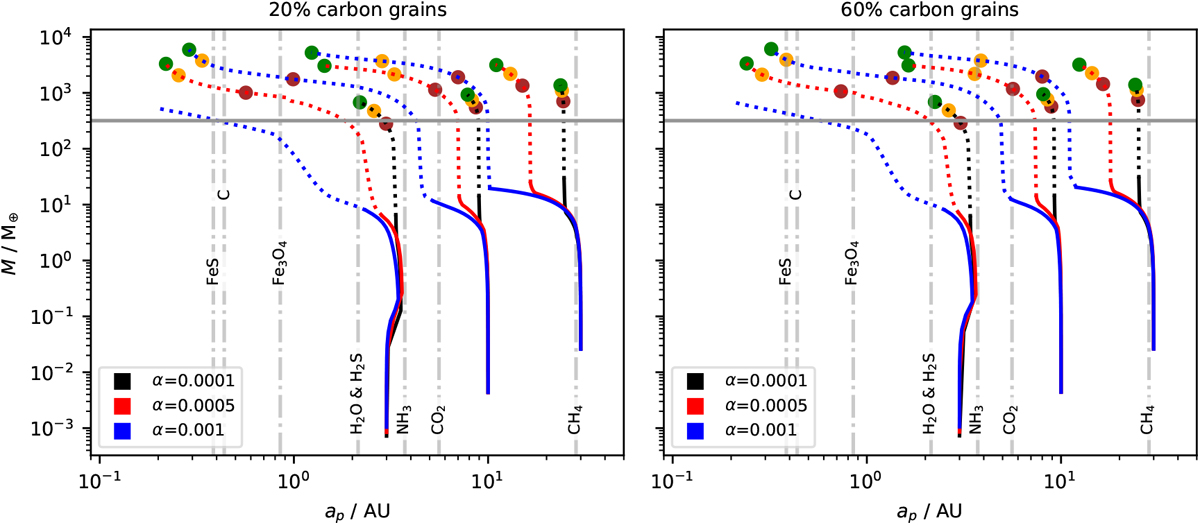
Growth tracks of planets that accrete pebbles (solid lines) and gas (dashed lines) starting at different initial positions in disks with different values for α (indicated by color). The dashed gray lines mark the positions of evaporation lines for α = 5 × 10⁻⁴. The solid gray horizontal line marks the mass of Jupiter. The brown, yellow, and green dots mark an evolution time of t = 1 Myr, t = 2 Myr, and t = 3 Myr, respectively. The planet starting at 3 AU in a disk with α = 0.001 reaches the inner edge of the disk before 1 Myr of evolution. The left panels display models with 20% of the carbon abundance locked in refractory carbon grains, whereas the right panels show models with 60% locked in carbon grains. Model parameters can be found in Table 2.
Current usage metrics show cumulative count of Article Views (full-text article views including HTML views, PDF and ePub downloads, according to the available data) and Abstracts Views on Vision4Press platform.
Data correspond to usage on the plateform after 2015. The current usage metrics is available 48-96 hours after online publication and is updated daily on week days.
Initial download of the metrics may take a while.