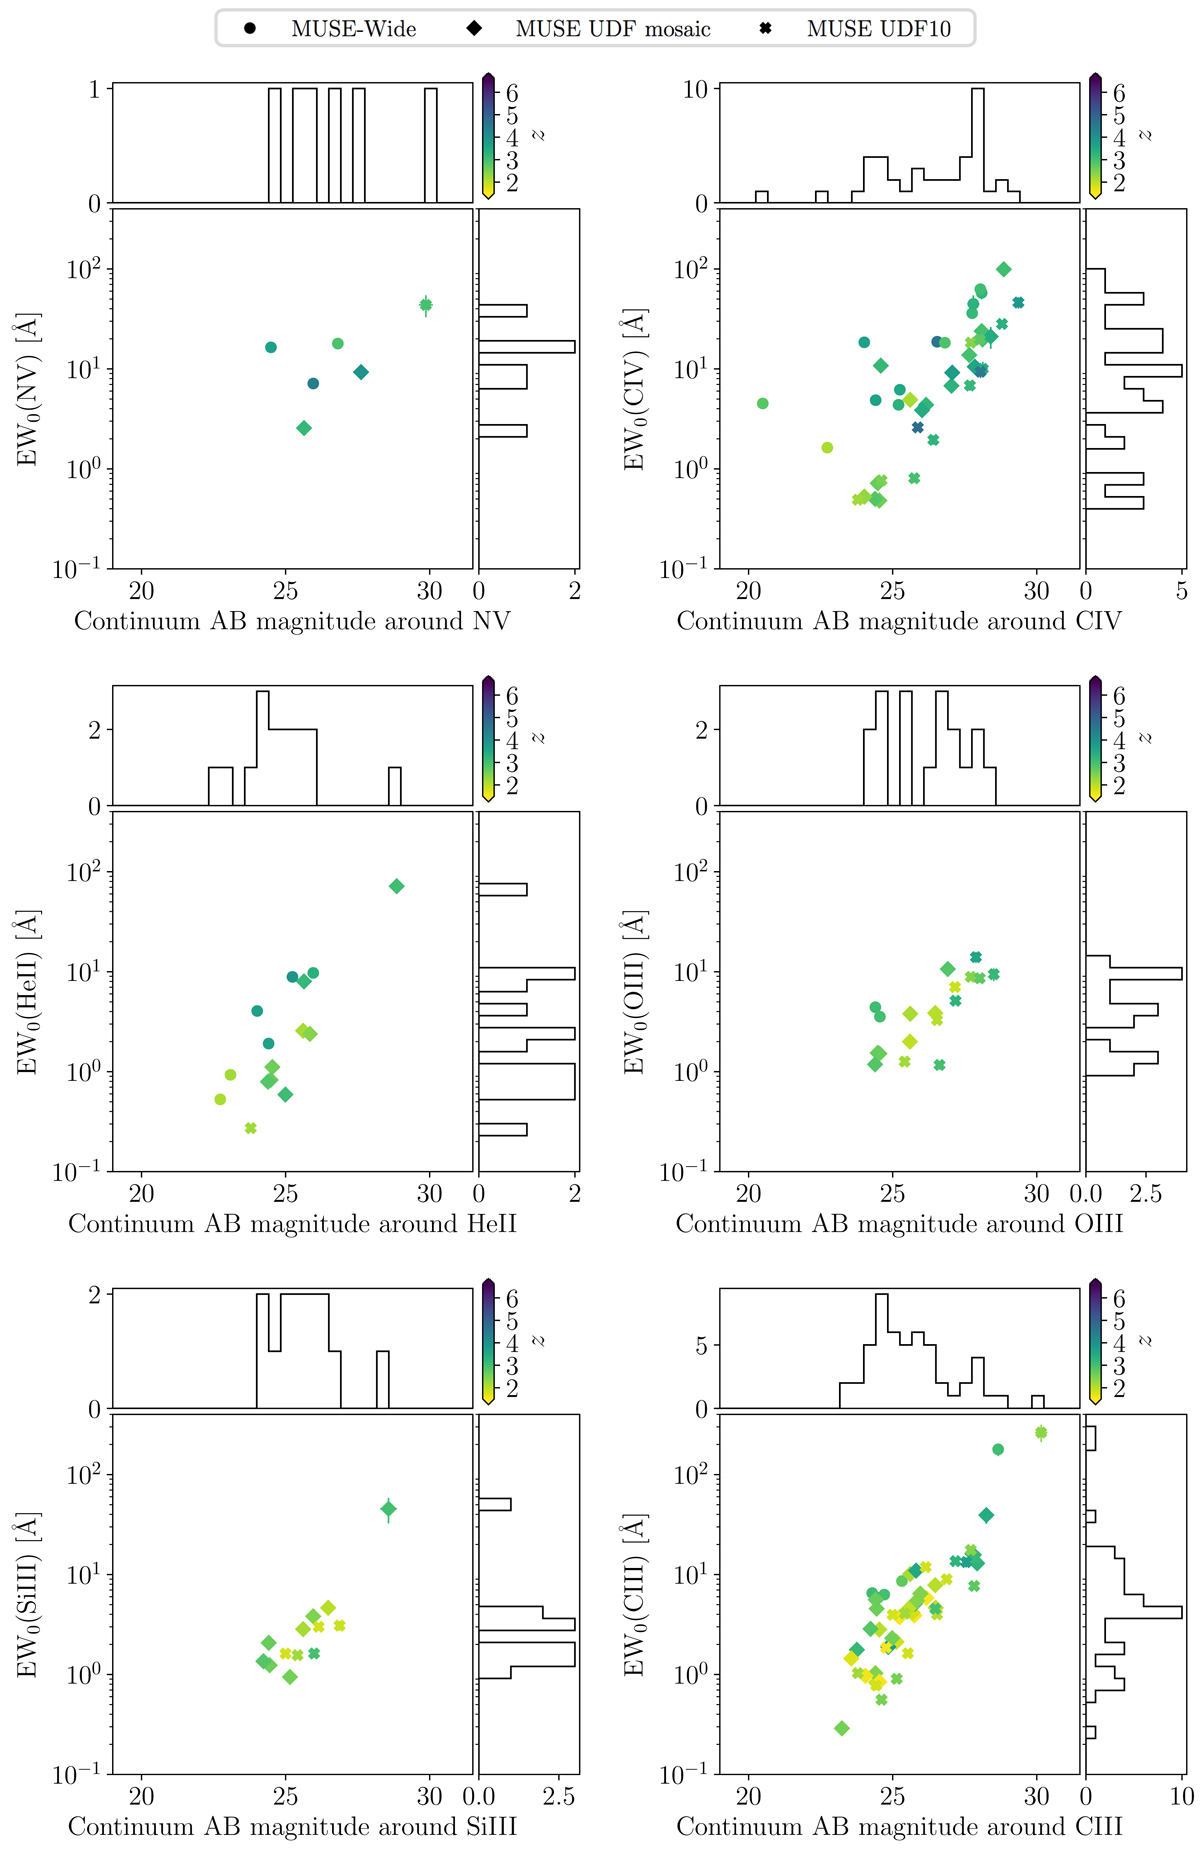
Fig. 8.
Download original image
Rest-frame equivalent width (EW0) of the UV emission lines detected by FELIS as a function of the continuum magnitude used to estimate the flux density at the emission line location. As in Fig. 5, filled circles, diamonds and x’s correspond to objects from the MUSE-Wide, the UDF mosaic and the UDF10 samples, respectively. Each point is color coded according to each object’s redshift.
Current usage metrics show cumulative count of Article Views (full-text article views including HTML views, PDF and ePub downloads, according to the available data) and Abstracts Views on Vision4Press platform.
Data correspond to usage on the plateform after 2015. The current usage metrics is available 48-96 hours after online publication and is updated daily on week days.
Initial download of the metrics may take a while.