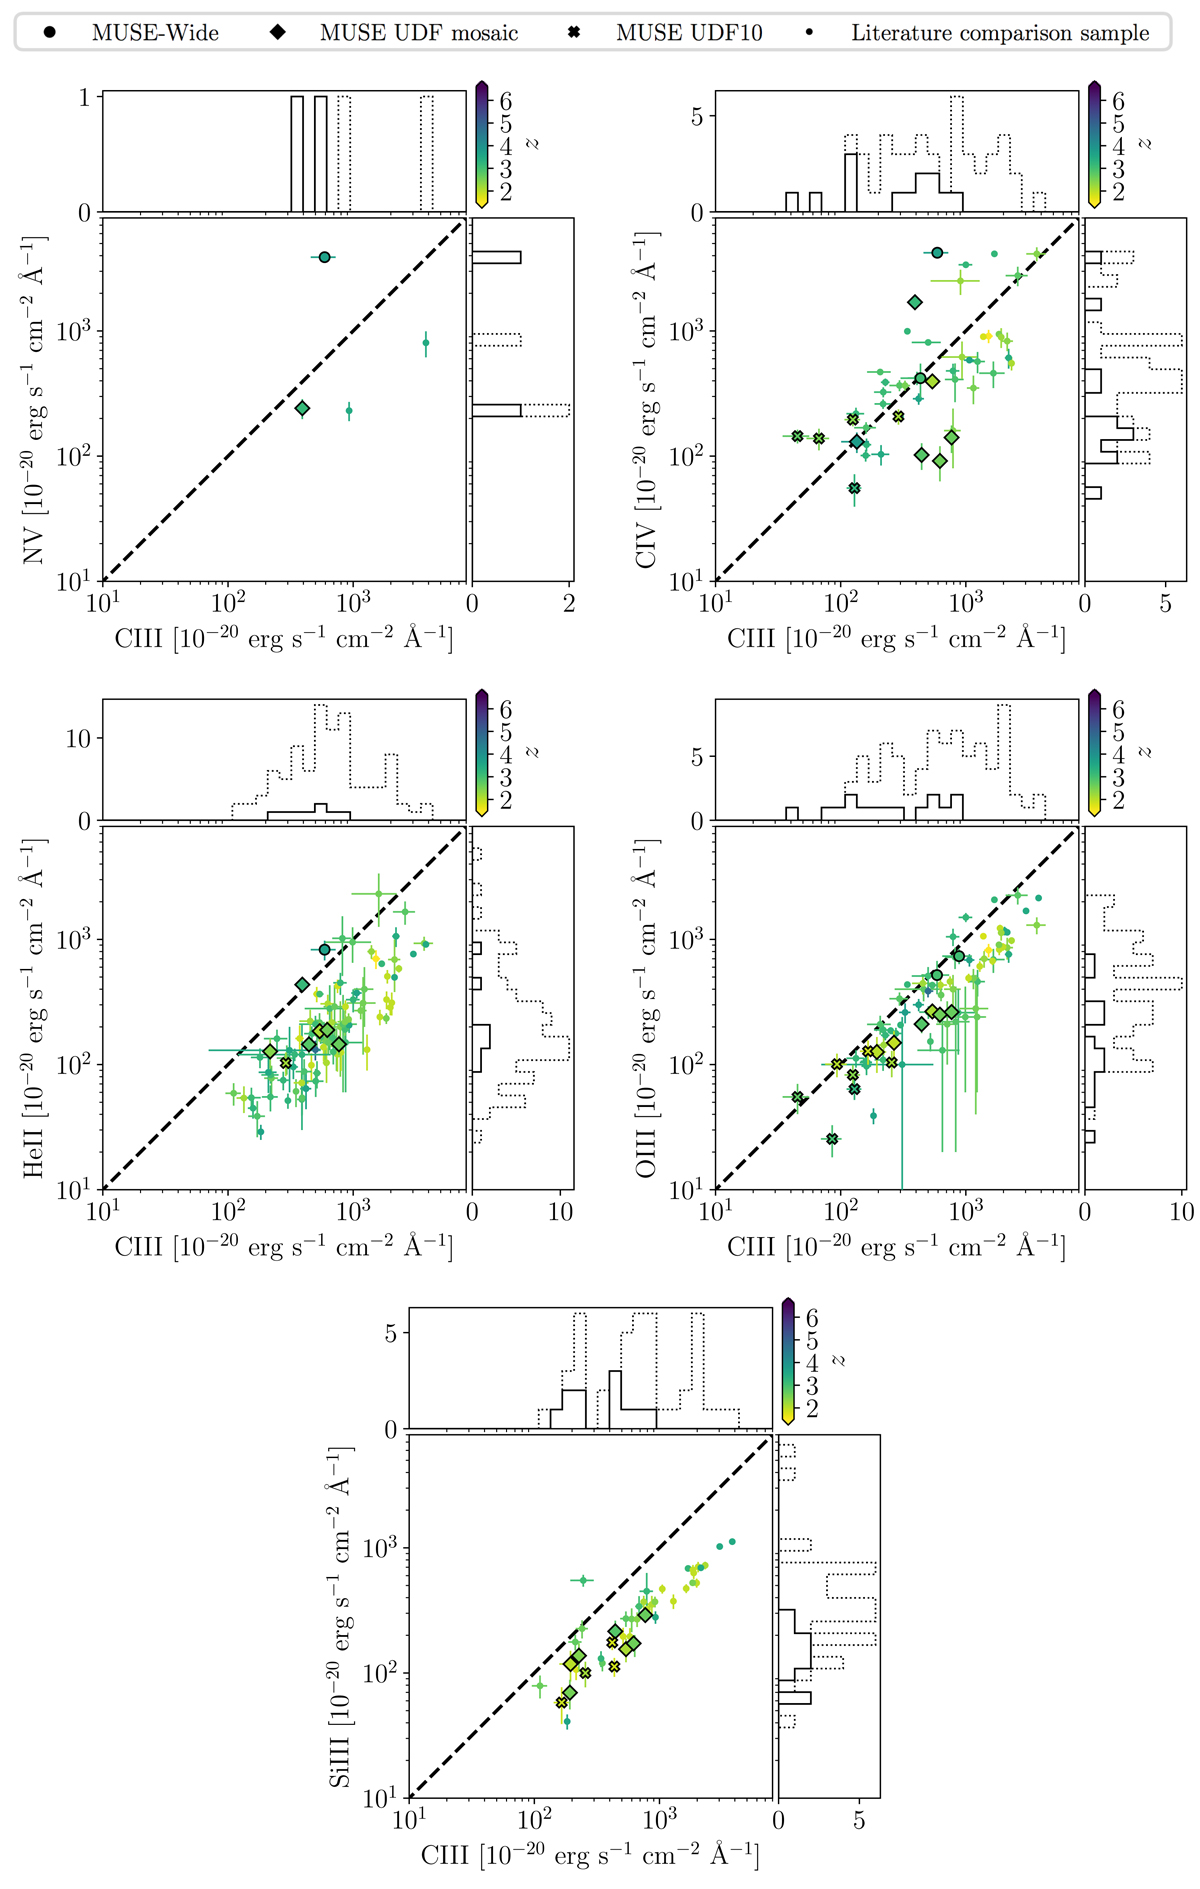
Fig. 6.
Download original image
Similar to Fig. 5, but showing correlations between the > 3σ C III detections and the other secondary UV emission line fluxes from MUSE-Wide, the UDF mosaic, and UDF10 shown as large symbols. The literature measurements described in Appendix C are shown by the small dots. The dashed lines show the one-to-one relations to guide the eye.
Current usage metrics show cumulative count of Article Views (full-text article views including HTML views, PDF and ePub downloads, according to the available data) and Abstracts Views on Vision4Press platform.
Data correspond to usage on the plateform after 2015. The current usage metrics is available 48-96 hours after online publication and is updated daily on week days.
Initial download of the metrics may take a while.