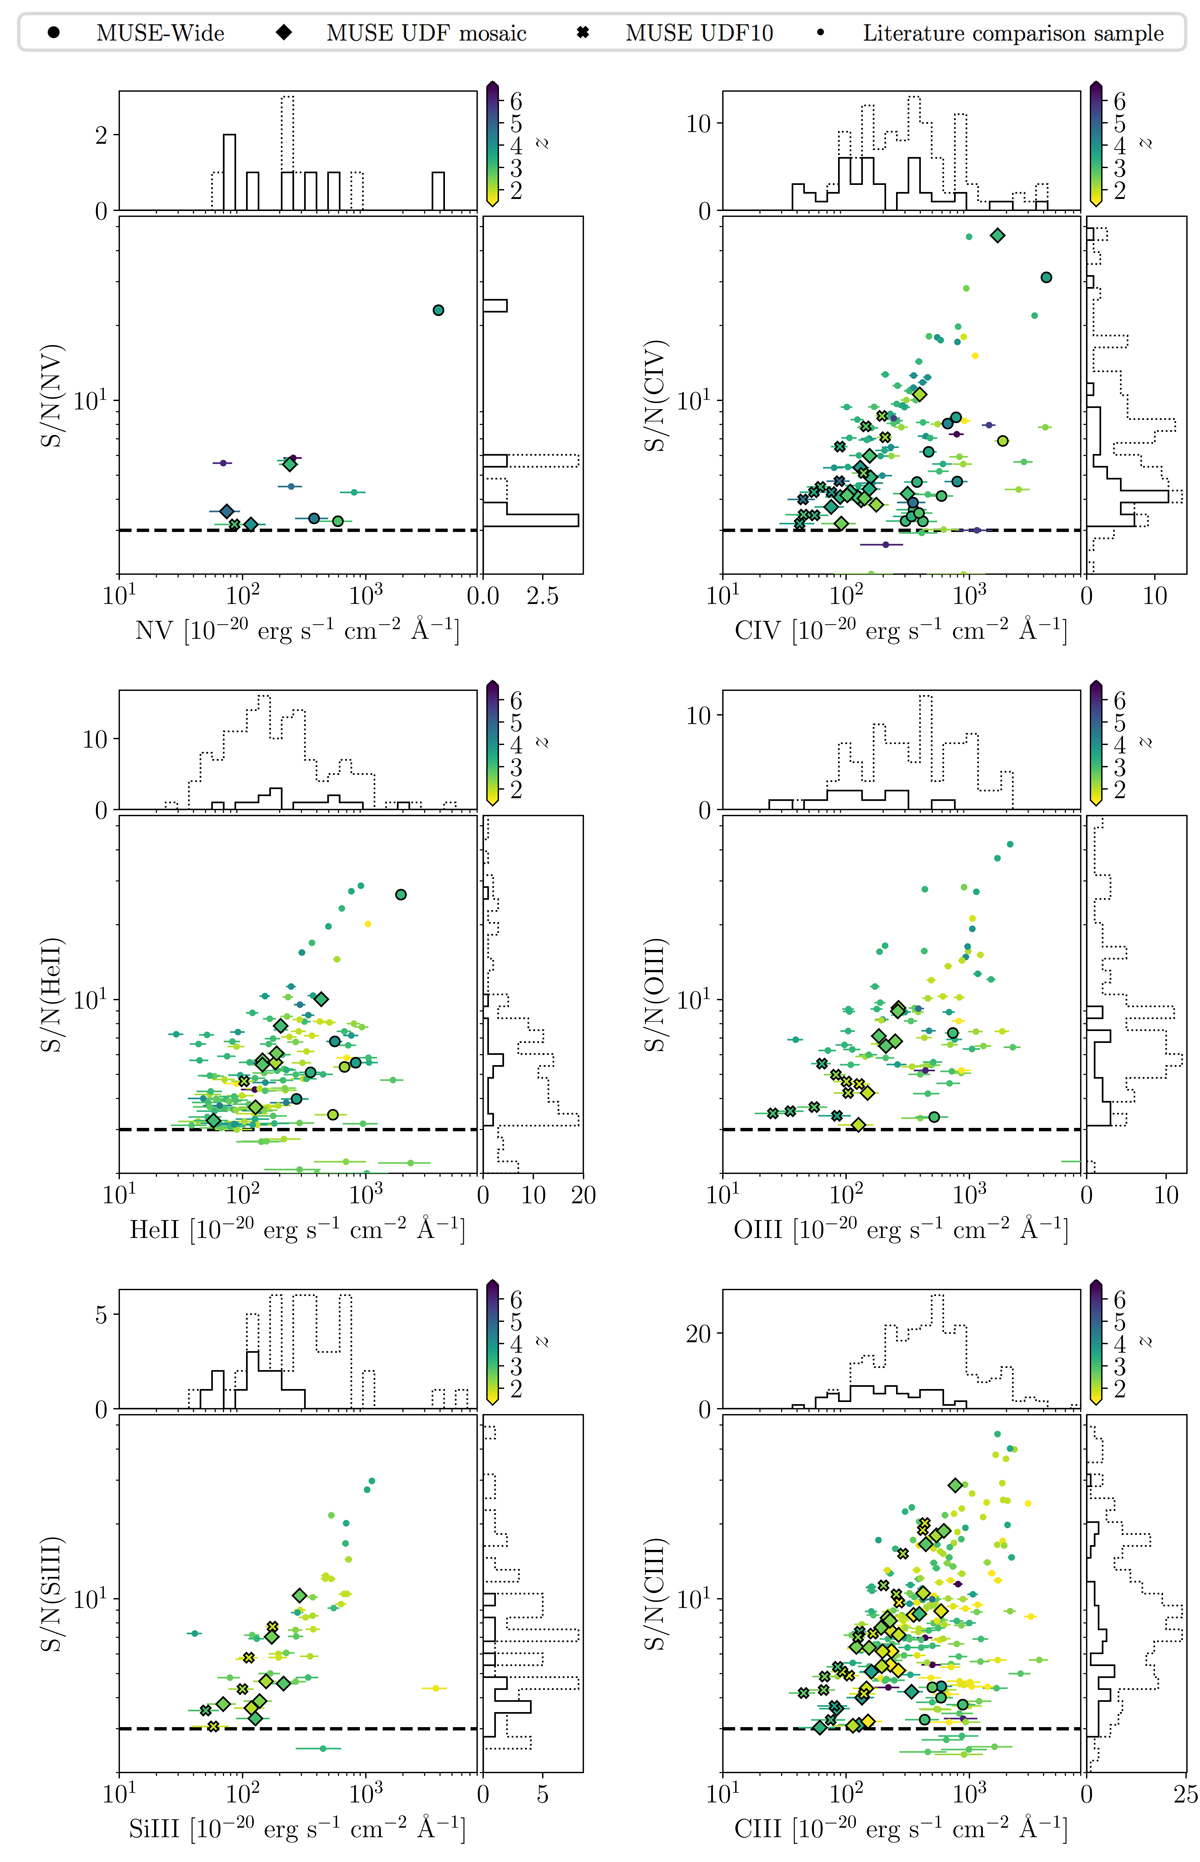
Fig. 5.
Download original image
Distribution of rest-frame UV emission line fluxes (x-axis) detected at a FELIS S/N (y-axis) above 3σ (horizontal dashed line) in the MUSE-Wide (filled circles), the UDF mosaic (filled diamonds), and the UDF10 (filled x’s) data sets studied in this paper. These detections are compared to the collection of detections from the literature (small dots) described in Appendix C. Here S/N represents the emission line S/N quoted in the original references. All points are color coded according to their redshift. The solid histograms show the subset of the objects from this work. The dotted histograms show the distribution of measurements when including the literature data.
Current usage metrics show cumulative count of Article Views (full-text article views including HTML views, PDF and ePub downloads, according to the available data) and Abstracts Views on Vision4Press platform.
Data correspond to usage on the plateform after 2015. The current usage metrics is available 48-96 hours after online publication and is updated daily on week days.
Initial download of the metrics may take a while.