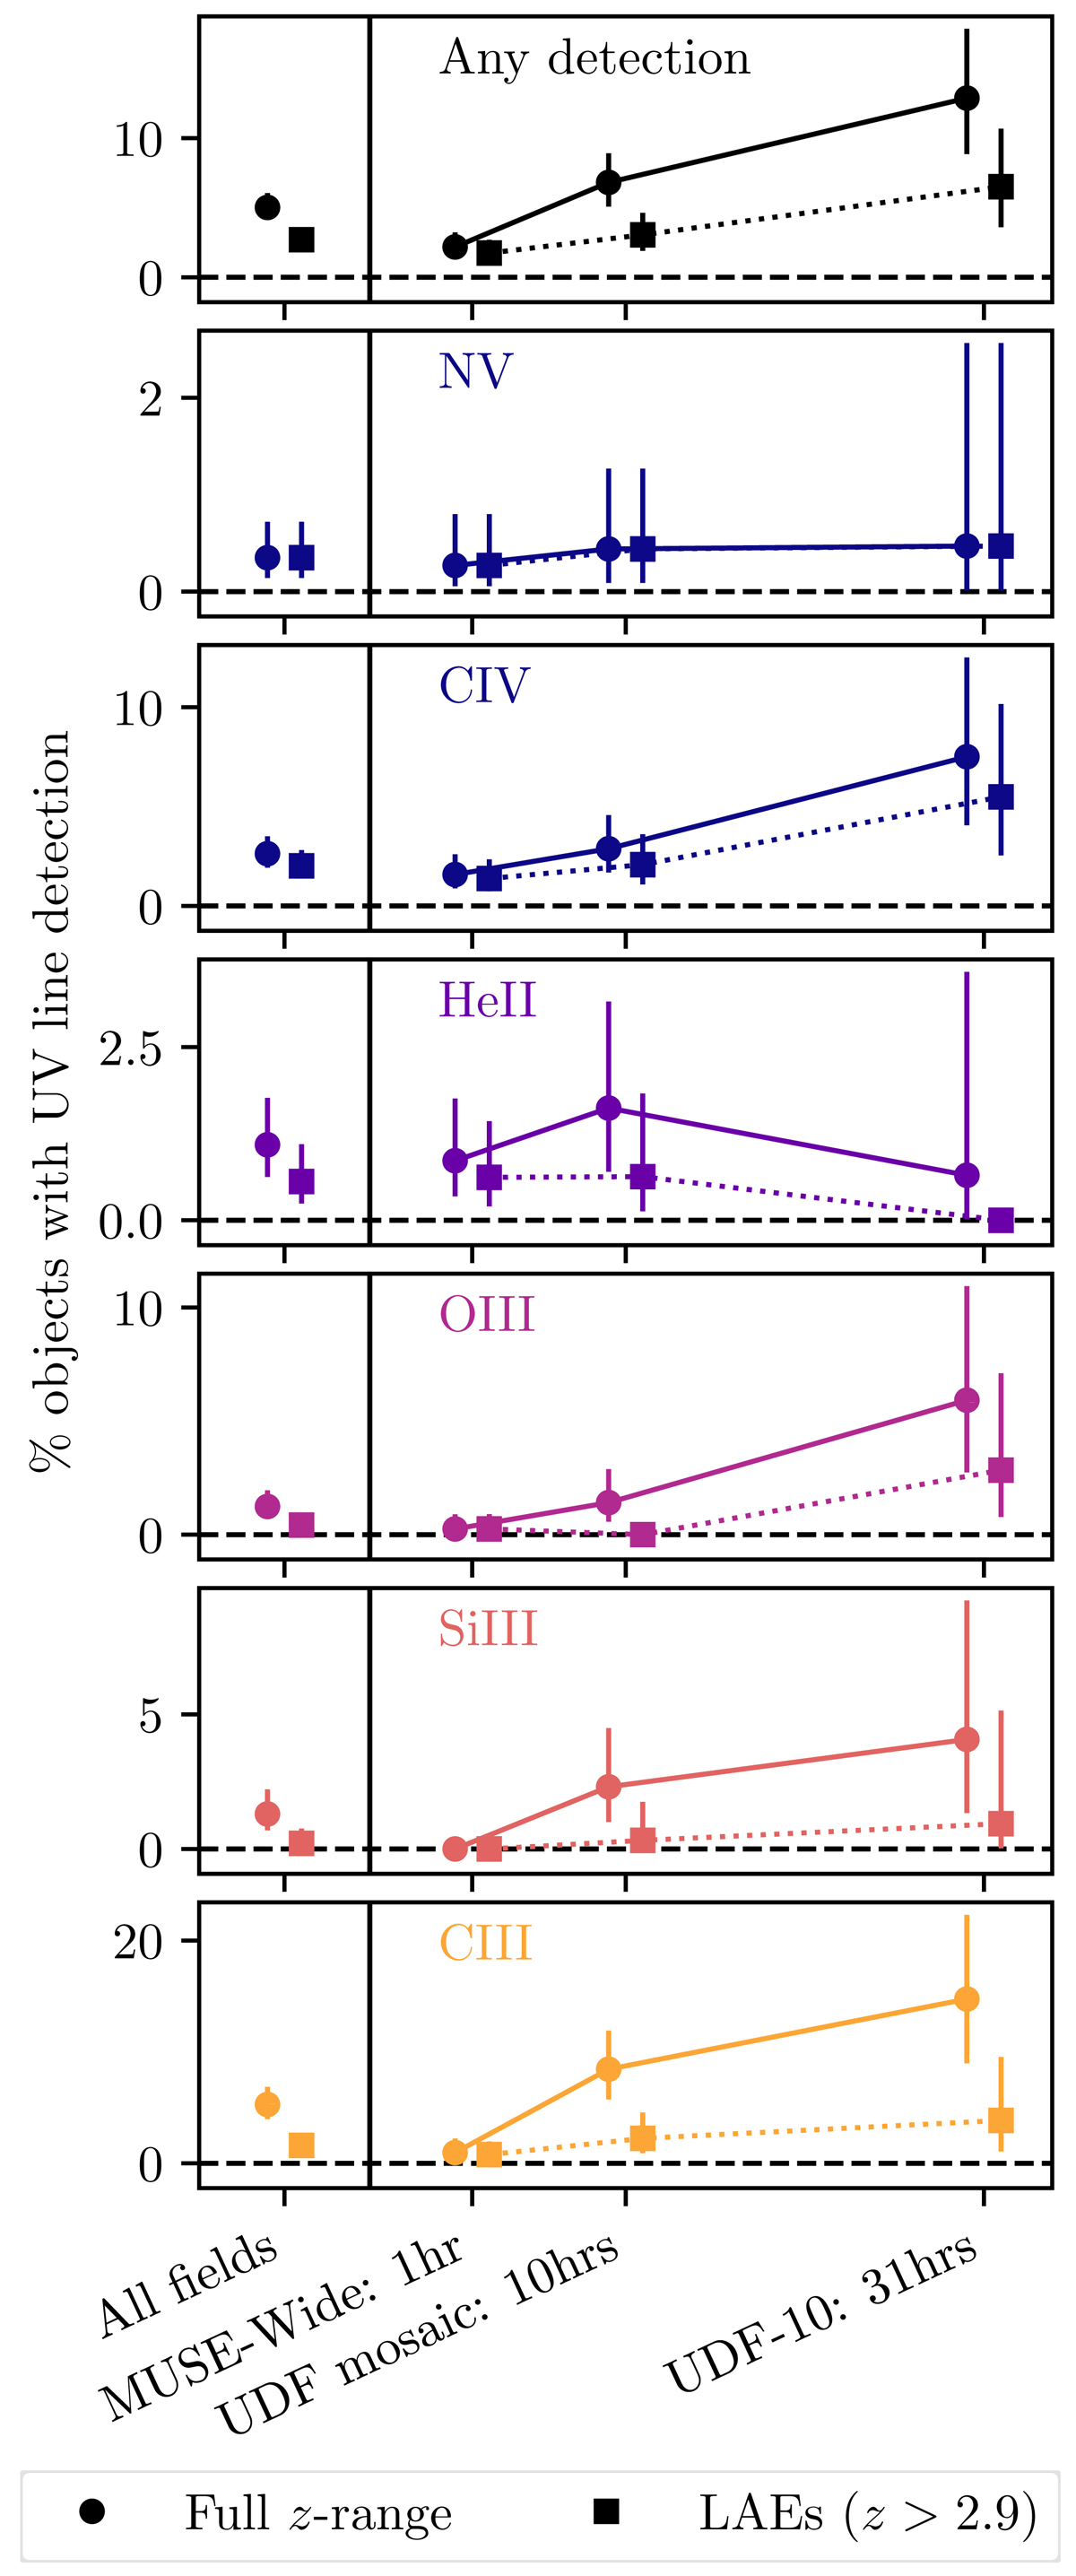
Fig. 4.
Download original image
Percentage of objects with detected secondary UV emission lines red-wards of Lyα for the full sample (circles) and the subsample of LAEs (squares). The percentages are provided for all fields studied, the MUSE-Wide data (1 h depth), the UDF mosaic data (10 h depth) and the UDF10 pointing (31 h depth). The error bars indicate the 95% confidence Clopper–Pearson interval of the binomial distribution for k UV line detections given the n available objects searched (see Table 3).
Current usage metrics show cumulative count of Article Views (full-text article views including HTML views, PDF and ePub downloads, according to the available data) and Abstracts Views on Vision4Press platform.
Data correspond to usage on the plateform after 2015. The current usage metrics is available 48-96 hours after online publication and is updated daily on week days.
Initial download of the metrics may take a while.