Fig. C.1.
Download original image
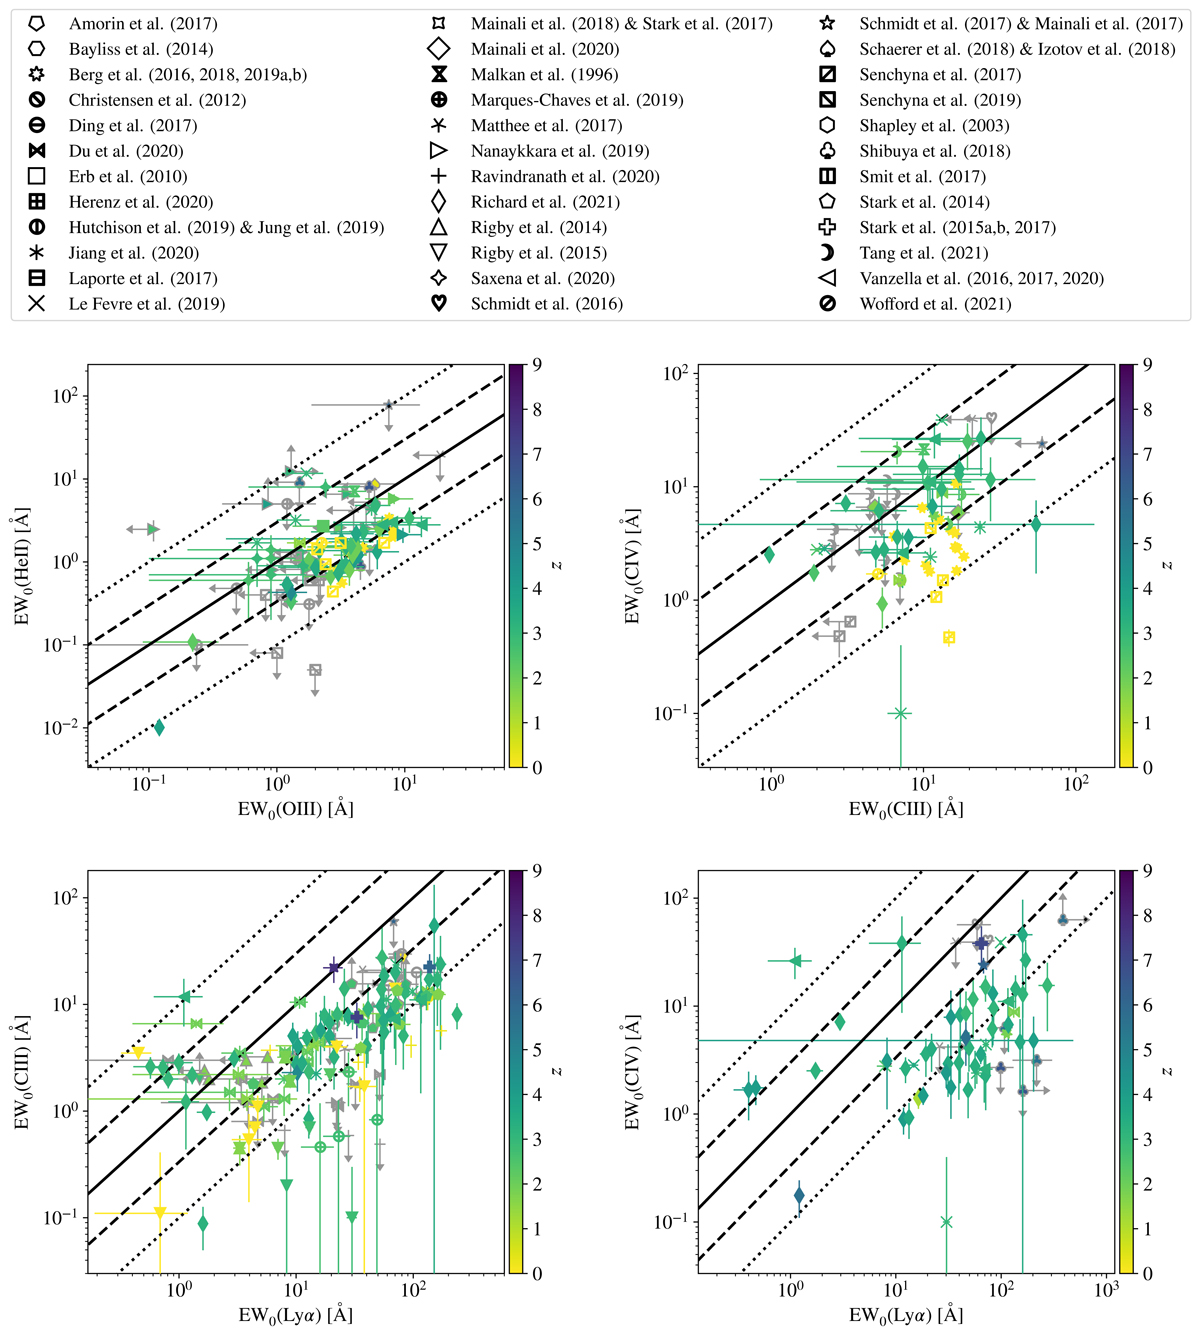
Projections of the rest-frame EW space spanned by EW0(He II), EW0(O III), EW0(C III), EW0(C IV) and EW0(Lyα) from the collection of UV emission line measurements from the literature plotted throughout this paper. The bottom panels reproduce the corresponding panels from Figure 10 and the top right panel reproduces the top right panel of Figure B.2. All panels exclude the MUSE measurements presented in this paper, but assign different symbols to the literature data included in Table C.1 according to the legend at the top. The points are color coded according to redshift and 3σ limits are indicated by the gray arrows. The diagonal curves correspond to the 10:1, 3:1, 1:1, 1:3, and 1:10 relations.
Current usage metrics show cumulative count of Article Views (full-text article views including HTML views, PDF and ePub downloads, according to the available data) and Abstracts Views on Vision4Press platform.
Data correspond to usage on the plateform after 2015. The current usage metrics is available 48-96 hours after online publication and is updated daily on week days.
Initial download of the metrics may take a while.