Fig. 3.
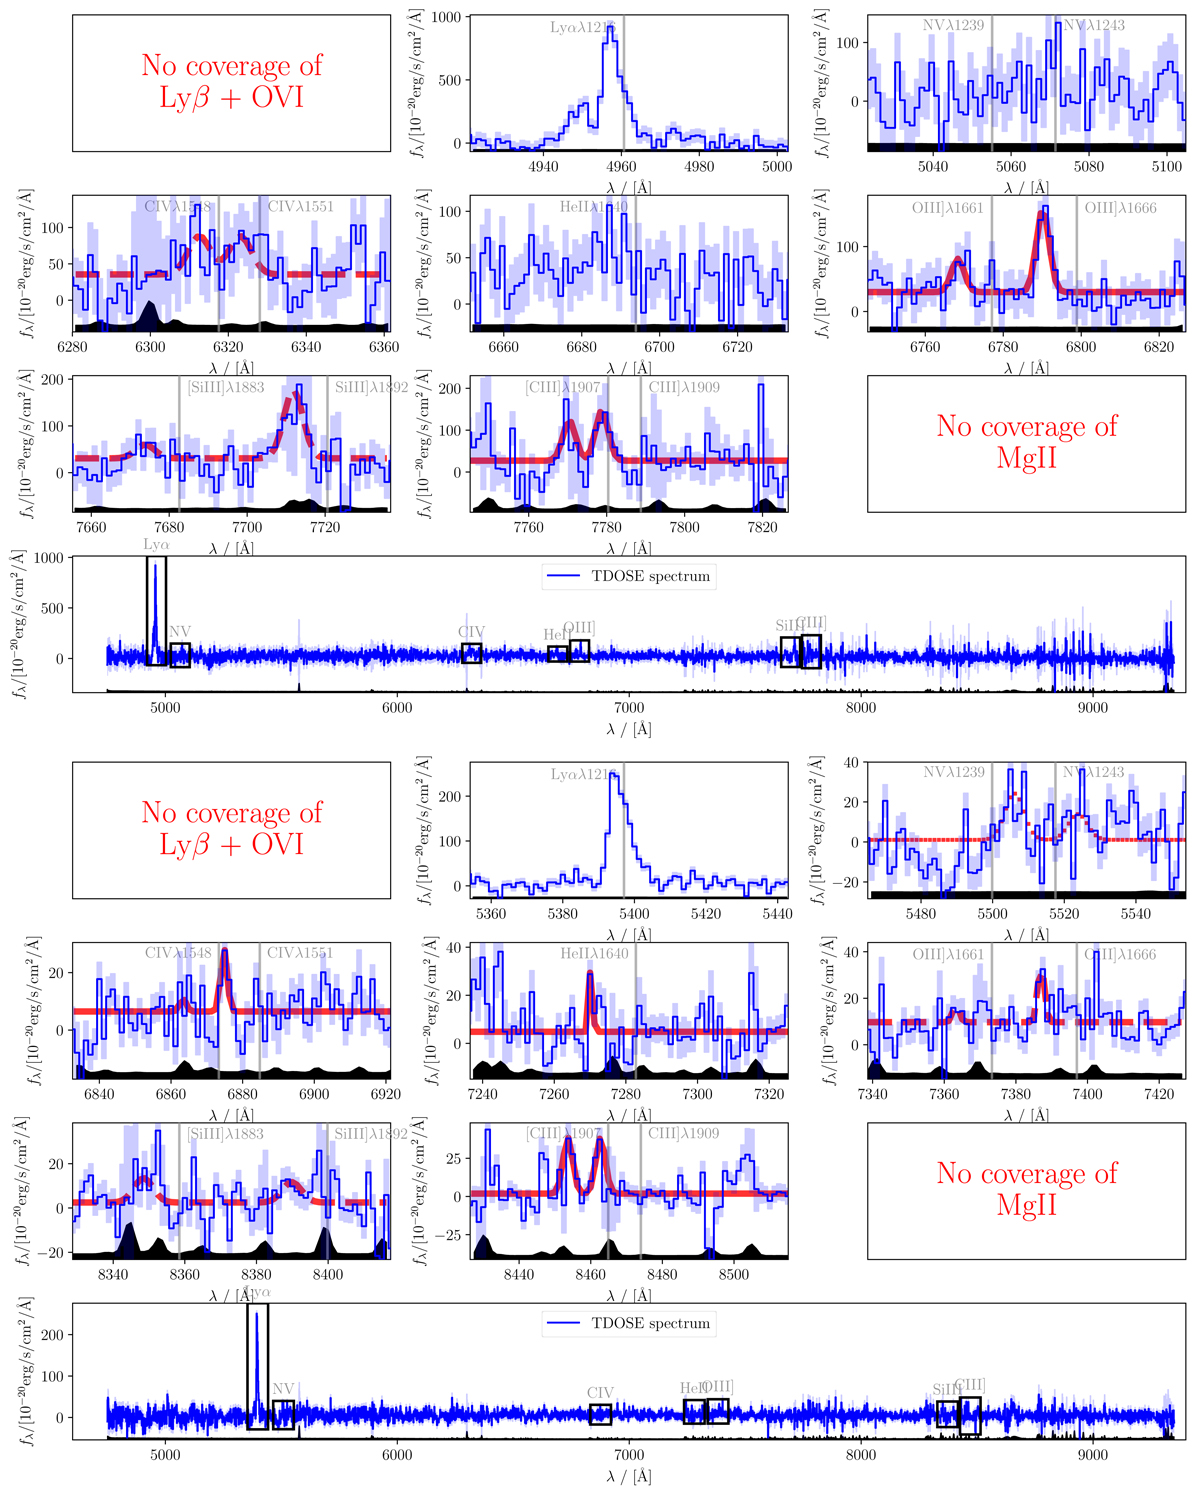
Download original image
Examples of TDOSE extracted 1D MUSE spectra (blue) of the two LAEs 201004081 (z = 3.08; top) and 602922055 (z = 3.44; bottom) with their 1σ error spectrum indicated by the blue-shaded region. Further examples can be found in Appendix E. Each of the smaller panels shows a UV emission line region as marked by the black boxes in the bottom panels, which show the full MUSE wavelength range. Vertical gray lines mark the approximate location of emission features based on the redshift of the LSDCat lead line. No continuum subtraction has been performed on the spectra. The UV emission lines detected by the software FELIS (Sect. 5) are marked by the red curves. The solid red curves show FELIS detections with S/N > 3 and a velocity offset below 1000 km s−1 deemed trustworthy in the visual inspection process. Dashed red curves show less secure detections, which were however deemed reliable. Dotted red curves show S/N > 3 and |Δv|< 1000 km s−1 FELIS detections classified as unreliable. In each panel 2× the median data cube noise in the respective fields (MUSE-Wide, MUSE mosaic and UDF10) are shown for reference as the black filled curves offset to the bottom of each panel for clarity. These median noise spectra are also shown in Fig. A.2.
Current usage metrics show cumulative count of Article Views (full-text article views including HTML views, PDF and ePub downloads, according to the available data) and Abstracts Views on Vision4Press platform.
Data correspond to usage on the plateform after 2015. The current usage metrics is available 48-96 hours after online publication and is updated daily on week days.
Initial download of the metrics may take a while.