Free Access
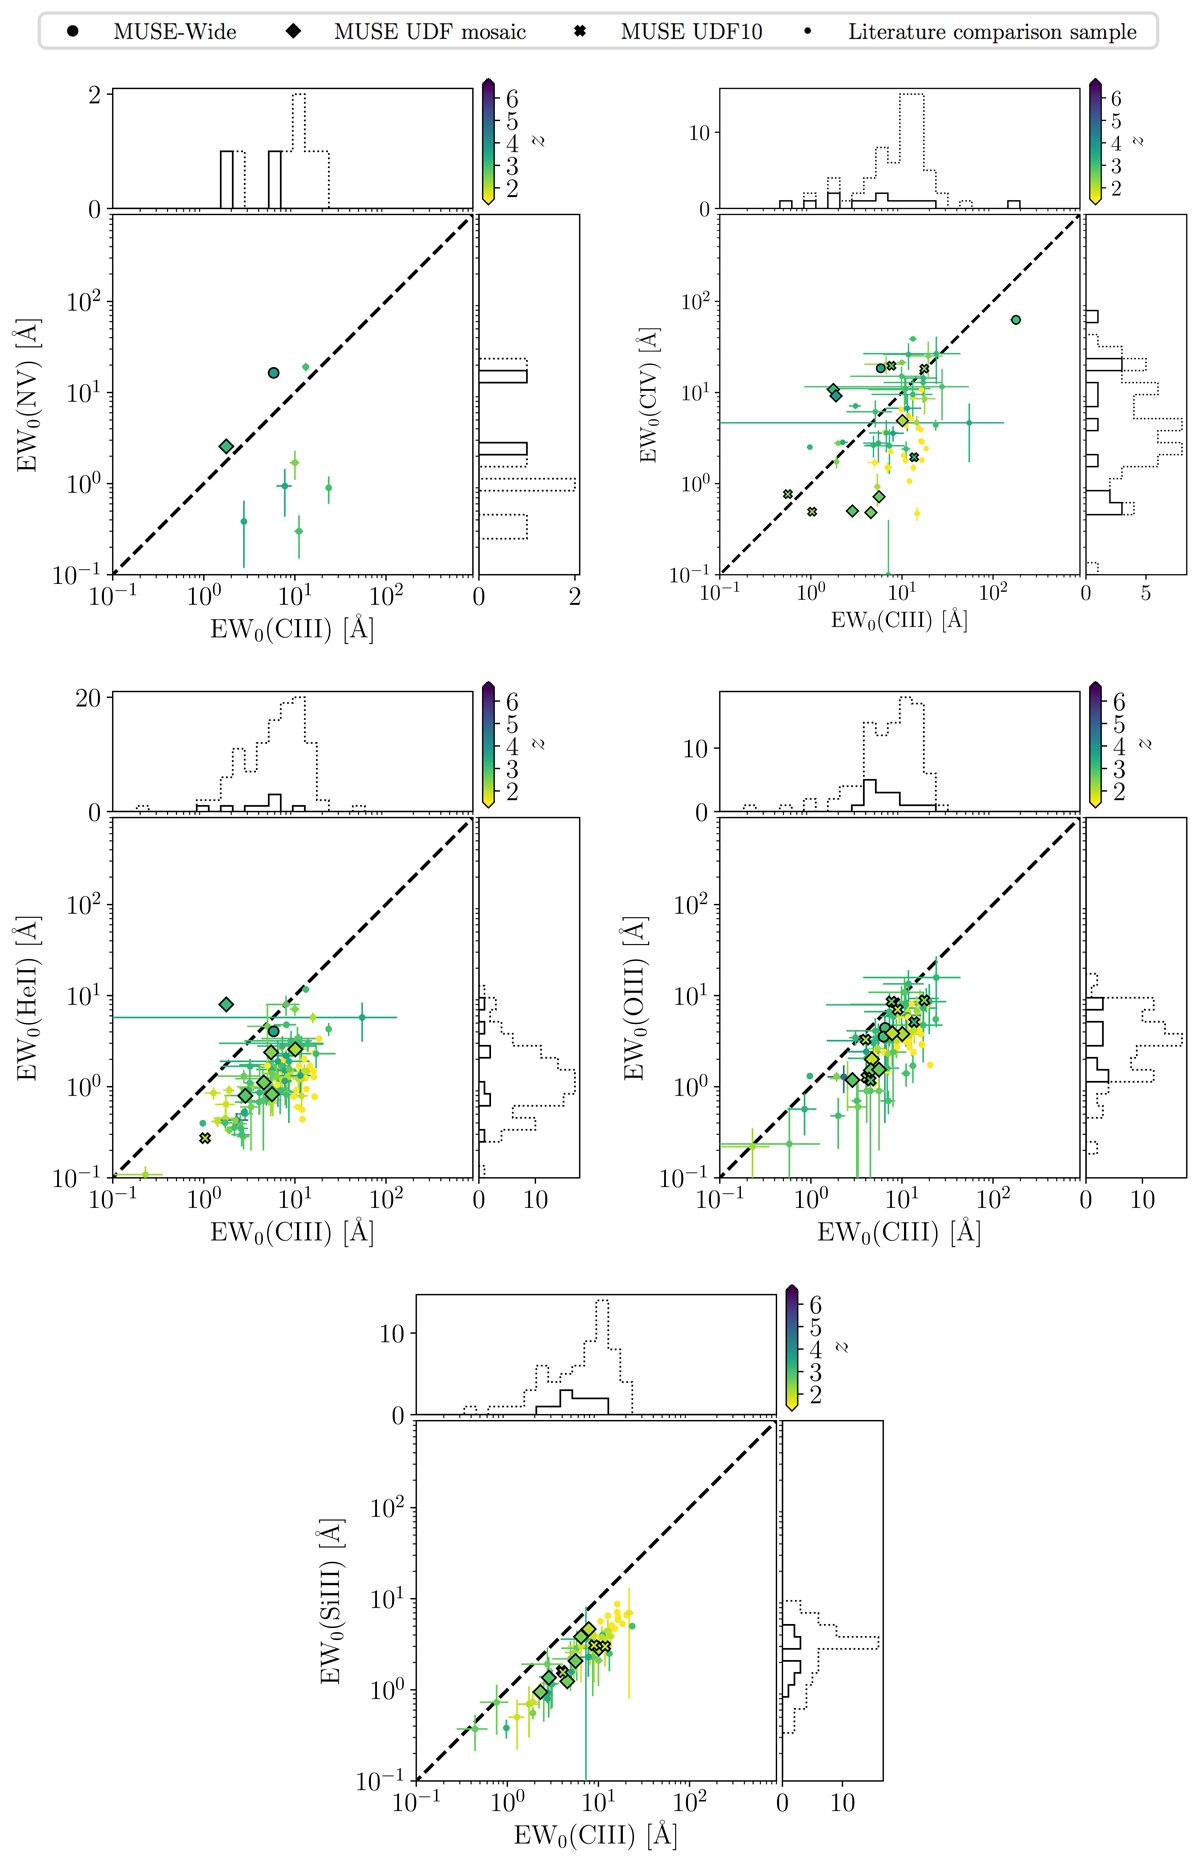
Fig. B.2.
Download original image
Similar to Figure 6, but showing correlations between EW0 estimates as described in Section 6 instead of emission line fluxes. The MUSE objects (large symbols) are shown together with the literature comparison sample described in Appendix C (small dots) and color coded according to redshift.
Current usage metrics show cumulative count of Article Views (full-text article views including HTML views, PDF and ePub downloads, according to the available data) and Abstracts Views on Vision4Press platform.
Data correspond to usage on the plateform after 2015. The current usage metrics is available 48-96 hours after online publication and is updated daily on week days.
Initial download of the metrics may take a while.