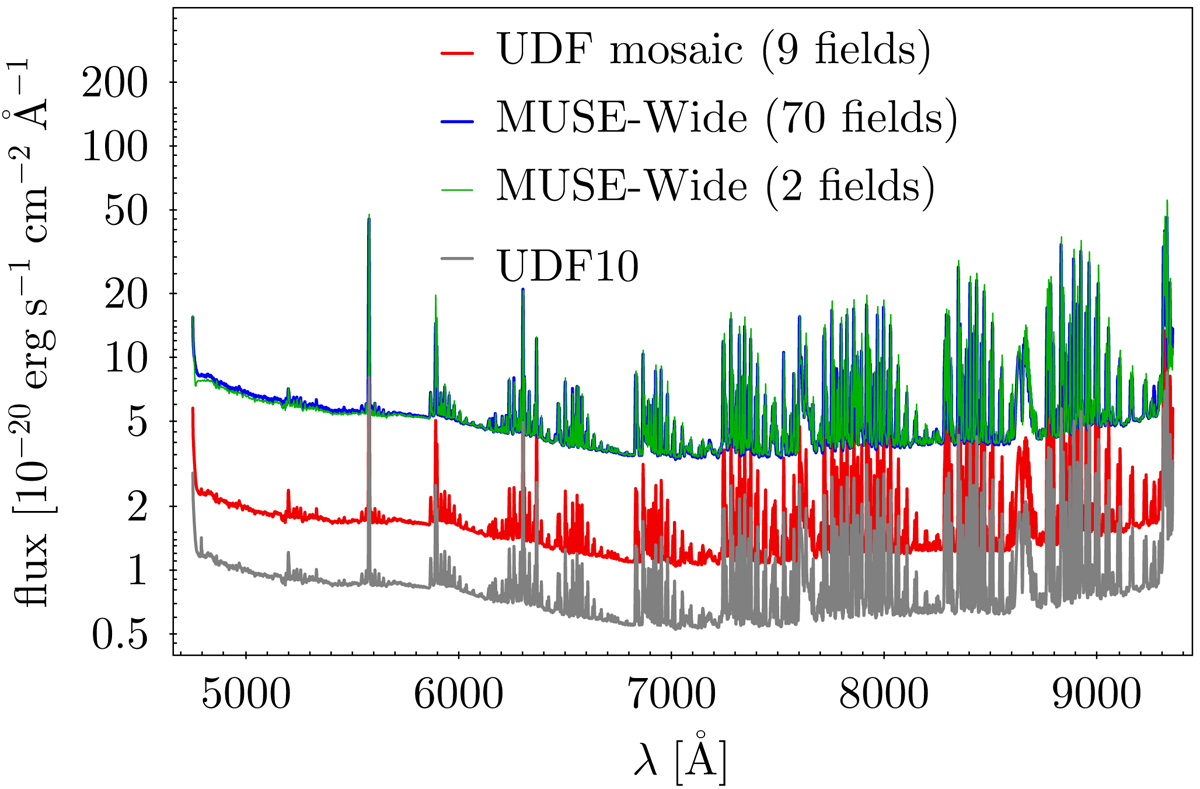
Fig. A.2.
Download original image
Median noise spectrum of two random MUSE-Wide pointings (green) and 70 GOODS-South and COSMOS MUSE-Wide pointings (blue – almost identical to the green curve). The latter spectrum was used to draw noisy flux values for the MUSE-Wide mock spectra that FELIS was tested on. For comparison, the median noise spectra of the deeper MUSE UDF mosaic and the UDF10 pointing are shown in red and gray. The median noise spectra shown in this panel are displayed by the black filled regions at the bottom of each panel in the spectral overviews in Figure 3 and Figures E.1–E.6.
Current usage metrics show cumulative count of Article Views (full-text article views including HTML views, PDF and ePub downloads, according to the available data) and Abstracts Views on Vision4Press platform.
Data correspond to usage on the plateform after 2015. The current usage metrics is available 48-96 hours after online publication and is updated daily on week days.
Initial download of the metrics may take a while.