Fig. A.1.
Download original image
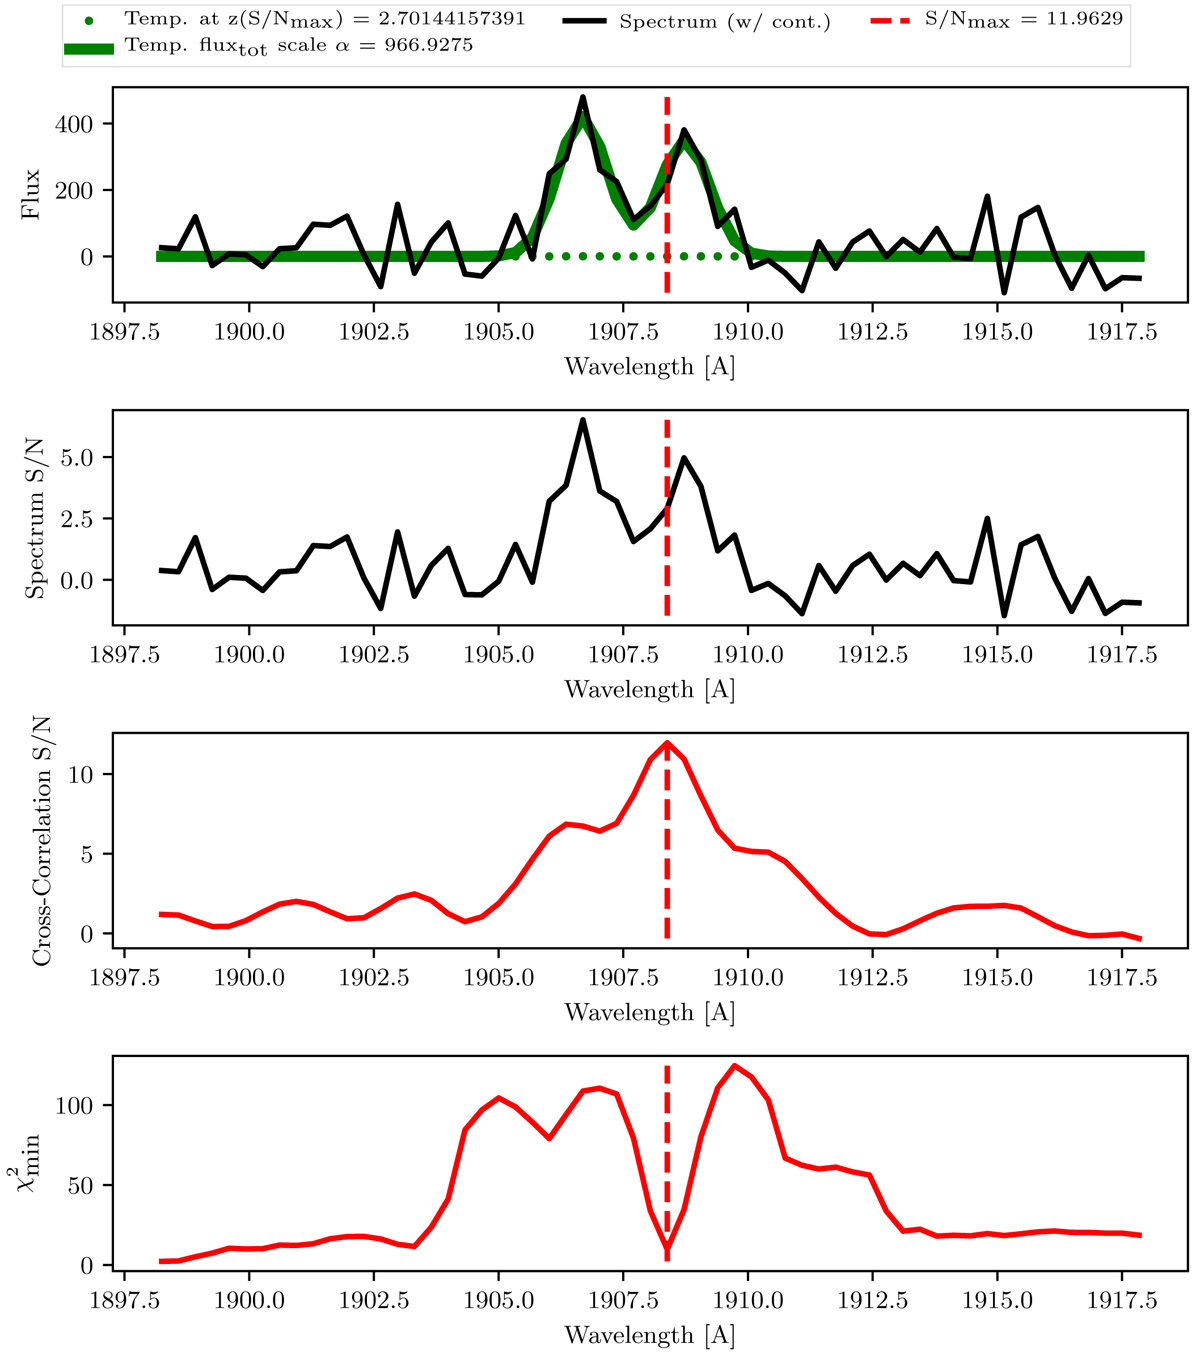
Overview of the FELIS template fit to a simulated spectrum of a C III emitter with a doublet flux ratio of F([C III])/F(C III]) = 1.4 corresponding to an electron density < 104 cm−3 (Osterbrock & Ferland 2006). The top panel shows the simulated spectrum (black) with the best-fit scaled template plotted on top (green). The second panel shows the S/N spectrum, that is flux/![]() . The third panel from the top shows the template cross-correlation S/N calculated with Equation A.6. The maximum value is indicated by the vertical dashed red line in all four panels. The bottom panel shows the χ2 estimate of the template cross-correlation.
. The third panel from the top shows the template cross-correlation S/N calculated with Equation A.6. The maximum value is indicated by the vertical dashed red line in all four panels. The bottom panel shows the χ2 estimate of the template cross-correlation.
Current usage metrics show cumulative count of Article Views (full-text article views including HTML views, PDF and ePub downloads, according to the available data) and Abstracts Views on Vision4Press platform.
Data correspond to usage on the plateform after 2015. The current usage metrics is available 48-96 hours after online publication and is updated daily on week days.
Initial download of the metrics may take a while.