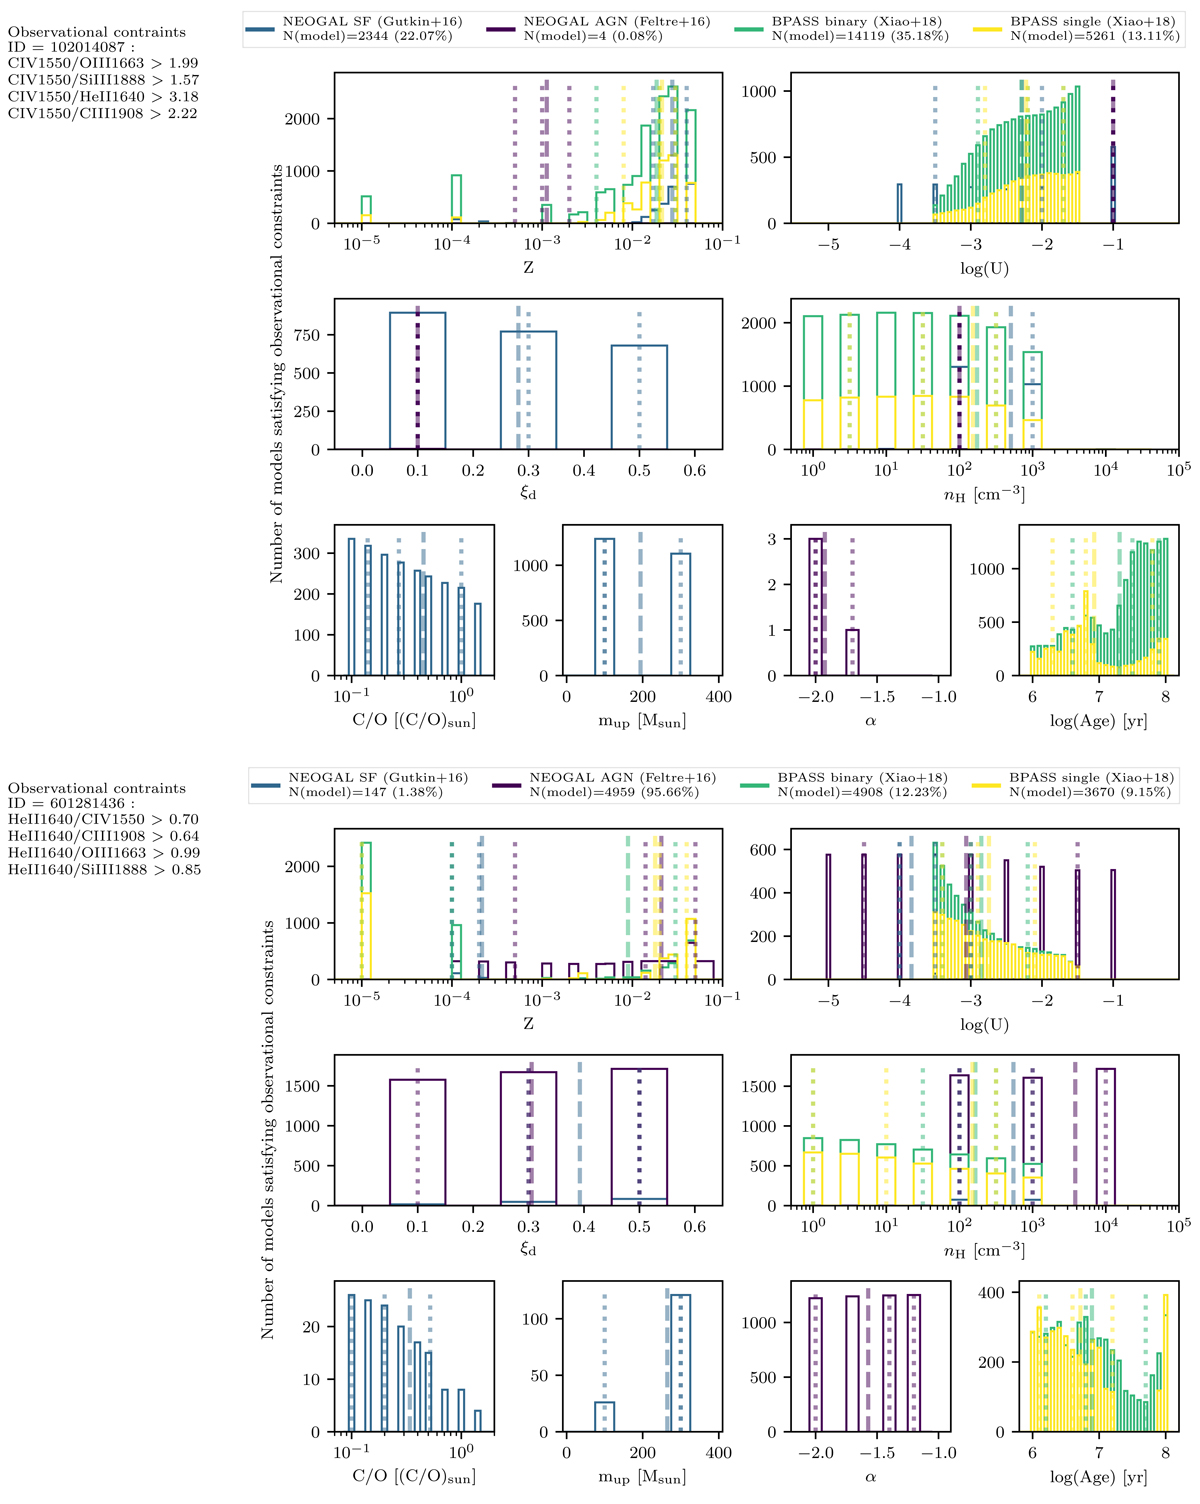
Fig. 20.
Download original image
Examples of PhotoIonization Model Probability Density Functions (PIM-PDFs) for the objects 102014087 (top) and 601281436 (bottom). The histograms in the different panels show the distribution of AGN (purple; Feltre et al. 2016), star forming (blue; Gutkin et al. 2016), BPASS binary (green) and single star (yellow; Xiao et al. 2018) photoionization model parameters satisfying the observational emission line flux ratio constraints listed in the left margin. The spacing of the parameter histograms’ bars indicate the discreteness of the sampling of each parameter space sampled by the models as listed in Table 5. The spectra of the two objects are shown in Fig. E.3. The limits on the observed flux ratios are all 3σ. The vertical dotted lines show the median values and the 68% confidence intervals of the distributions. The vertical dashed lines mark the mean values. For comparison the full unconstrained set of PIM-PDFs are shown in Fig. D.1.
Current usage metrics show cumulative count of Article Views (full-text article views including HTML views, PDF and ePub downloads, according to the available data) and Abstracts Views on Vision4Press platform.
Data correspond to usage on the plateform after 2015. The current usage metrics is available 48-96 hours after online publication and is updated daily on week days.
Initial download of the metrics may take a while.