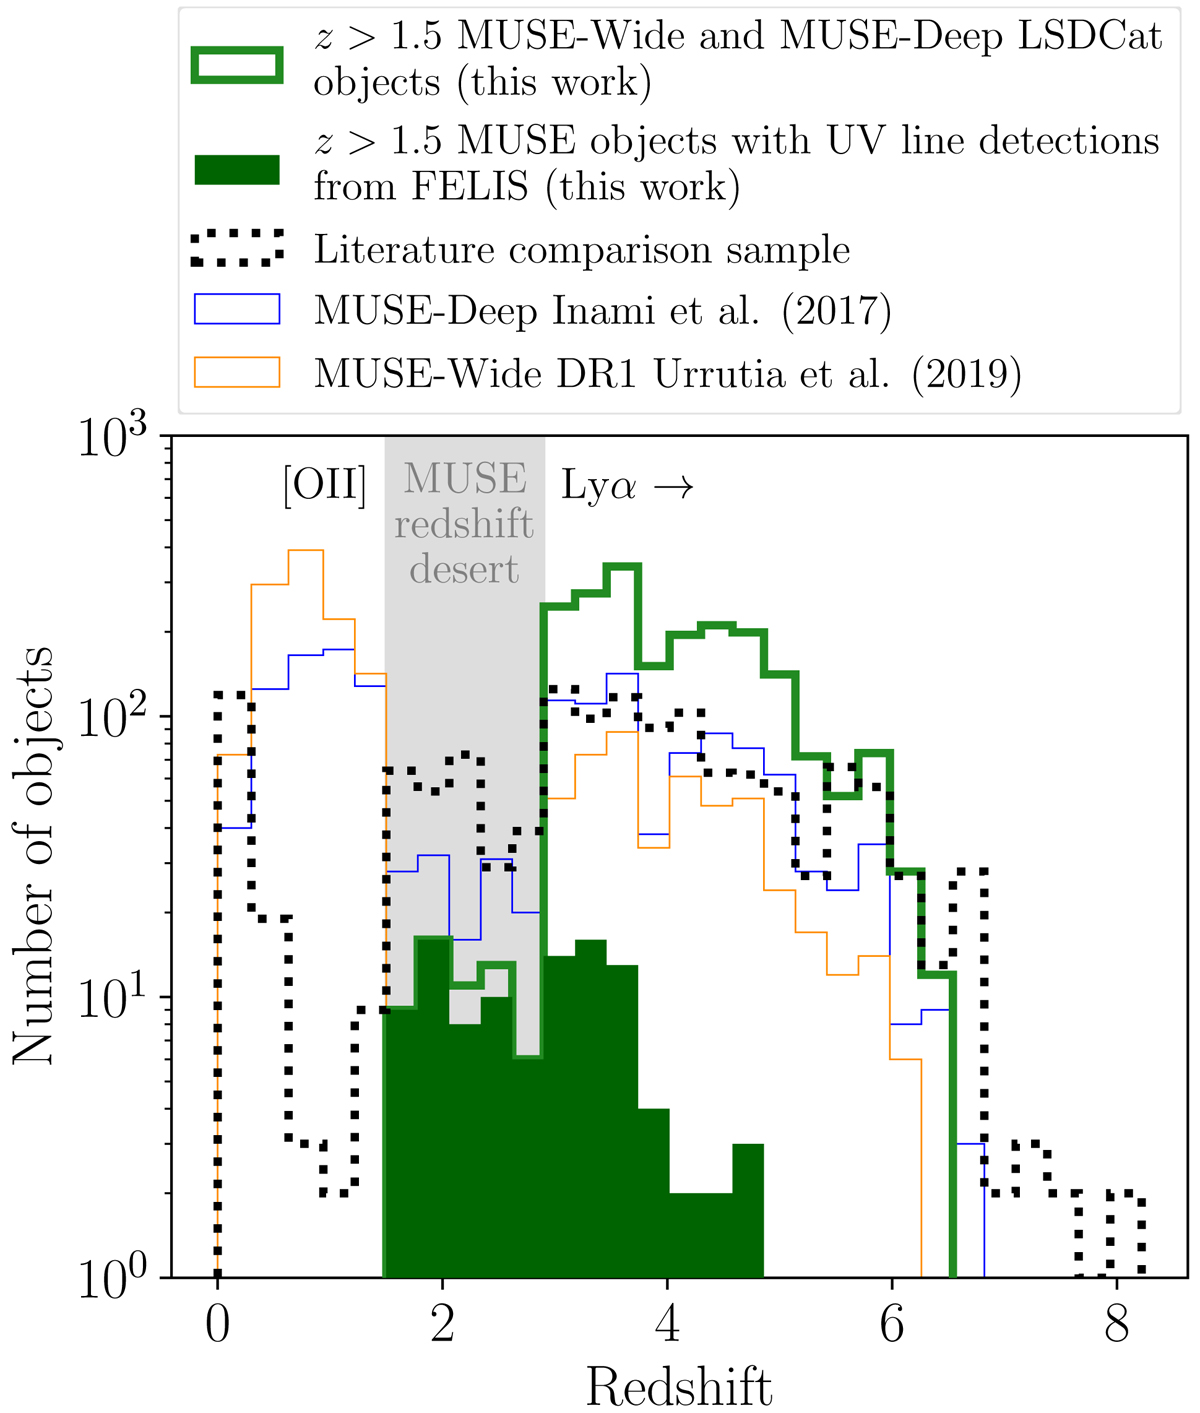
Fig. 2.
Download original image
Redshift distributions of the sources studied here (thick green histogram), the subsample of them with UV emission lines detected by FELIS (filled dark green histogram), the comparison sample of UV line emitters from the literature described in Appendix C (dotted black histogram), the MUSE-Wide DR1 catalog by Urrutia et al. (2019, thin orange histogram), and the independent MUSE-Deep UDF mosaic and UDF10 catalog presented by Inami et al. (2017, thin blue histogram). The MUSE redshift desert where neither [O II] λ3726 + [O II] λ3729 (0.3 < z < 1.5) nor Lyα (z > 2.9) emission is available for redshift identification in the MUSE wavelength range is marked by the gray band.
Current usage metrics show cumulative count of Article Views (full-text article views including HTML views, PDF and ePub downloads, according to the available data) and Abstracts Views on Vision4Press platform.
Data correspond to usage on the plateform after 2015. The current usage metrics is available 48-96 hours after online publication and is updated daily on week days.
Initial download of the metrics may take a while.