Fig. 18.
Download original image
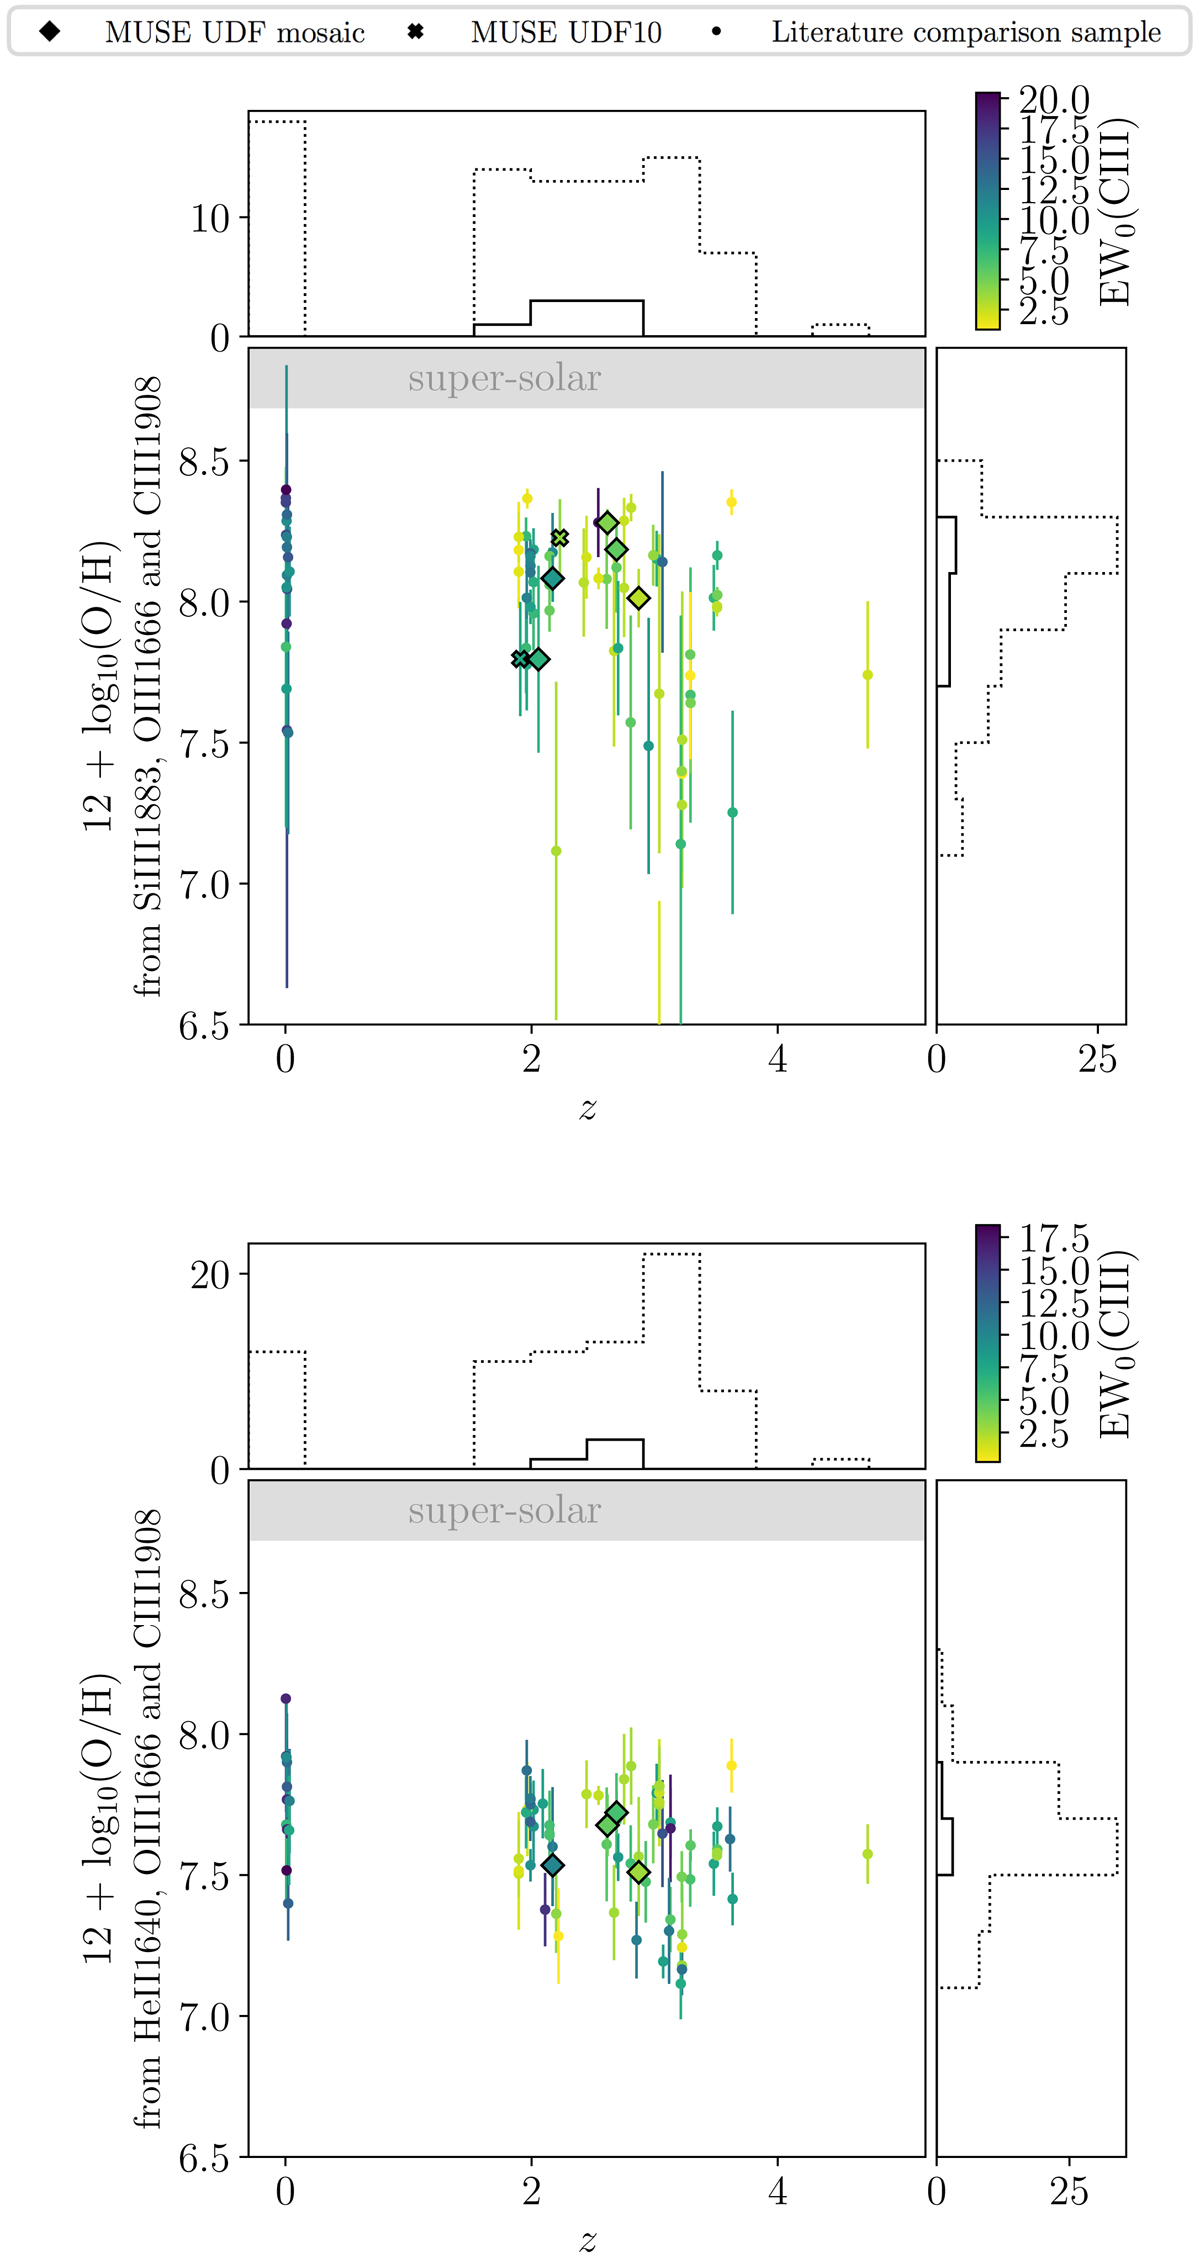
Gas-phase abundances estimated using the third order polynomial fitting functions for the Si3-O3C3 (top panel) and He2-03C3 (bottom panel) diagnostics from Byler et al. (2020) as a function of source redshift. The large symbols are MUSE sources from the UDF and small dots are from the literature collection described in Appendix C. The solid histograms show the subset of the objects from this work, whereas the dotted histograms also include the sources from the literature. All points are color coded according to EW0(C III). The gray bands mark regions of super-solar gas-phase abundances at 12 + log10(O/H) > 8.69.
Current usage metrics show cumulative count of Article Views (full-text article views including HTML views, PDF and ePub downloads, according to the available data) and Abstracts Views on Vision4Press platform.
Data correspond to usage on the plateform after 2015. The current usage metrics is available 48-96 hours after online publication and is updated daily on week days.
Initial download of the metrics may take a while.