Fig. 15.
Download original image
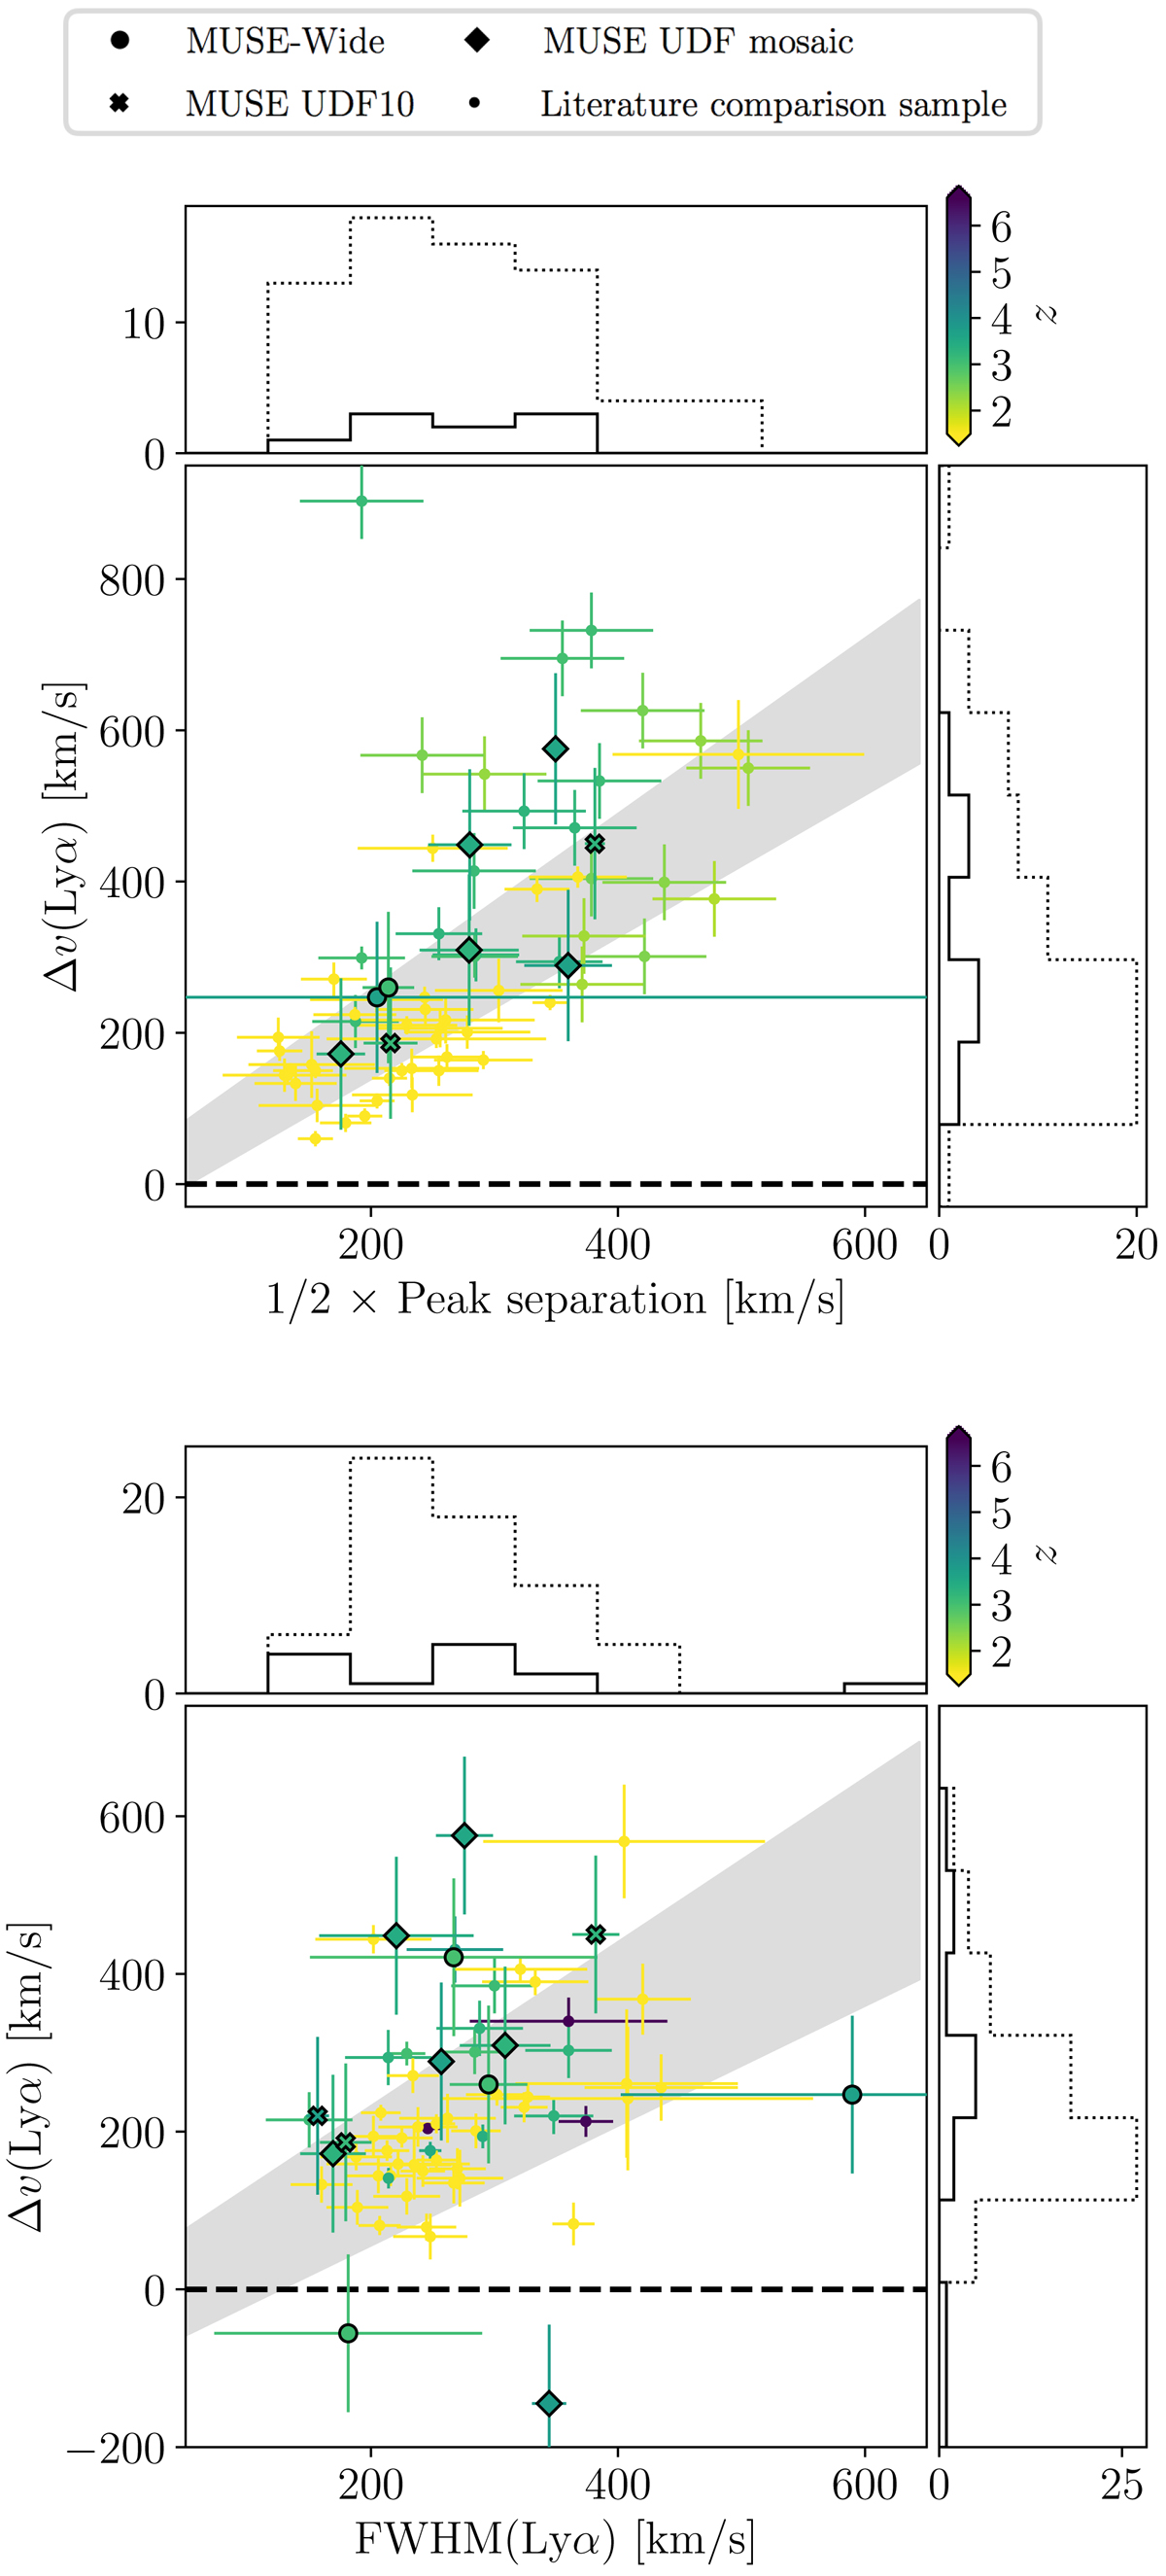
Comparison of the velocity offset of Lyα and half the Lyα peak separation for objects with Lyα line profiles containing both a red peak and a blue bump (top) and the Lyα FWHM (bottom). These are the quantities used to predict ΔvLyα (Verhamme et al. 2018 approx.) on the x-axis in Fig. 14. The gray bands show the empirical relations presented by Verhamme et al. (2018). The small dots present a collection of literature measurements from Kulas et al. (2012), Leitet et al. (2013), Oesch et al. (2015), Hashimoto et al. (2015), Henry et al. (2015), Guaita et al. (2016), Izotov et al. (2016a,b), Stark et al. (2017), Verhamme et al. (2017, 2018), Yang et al. (2017), Matthee et al. (2020b), Muzahid et al. (2020), and Matthee et al. (2021). All points are color coded according to object redshift. The solid histograms show the measurements presented in this study, whereas the dotted histograms include the measurements from the literature.
Current usage metrics show cumulative count of Article Views (full-text article views including HTML views, PDF and ePub downloads, according to the available data) and Abstracts Views on Vision4Press platform.
Data correspond to usage on the plateform after 2015. The current usage metrics is available 48-96 hours after online publication and is updated daily on week days.
Initial download of the metrics may take a while.