Fig. 5.
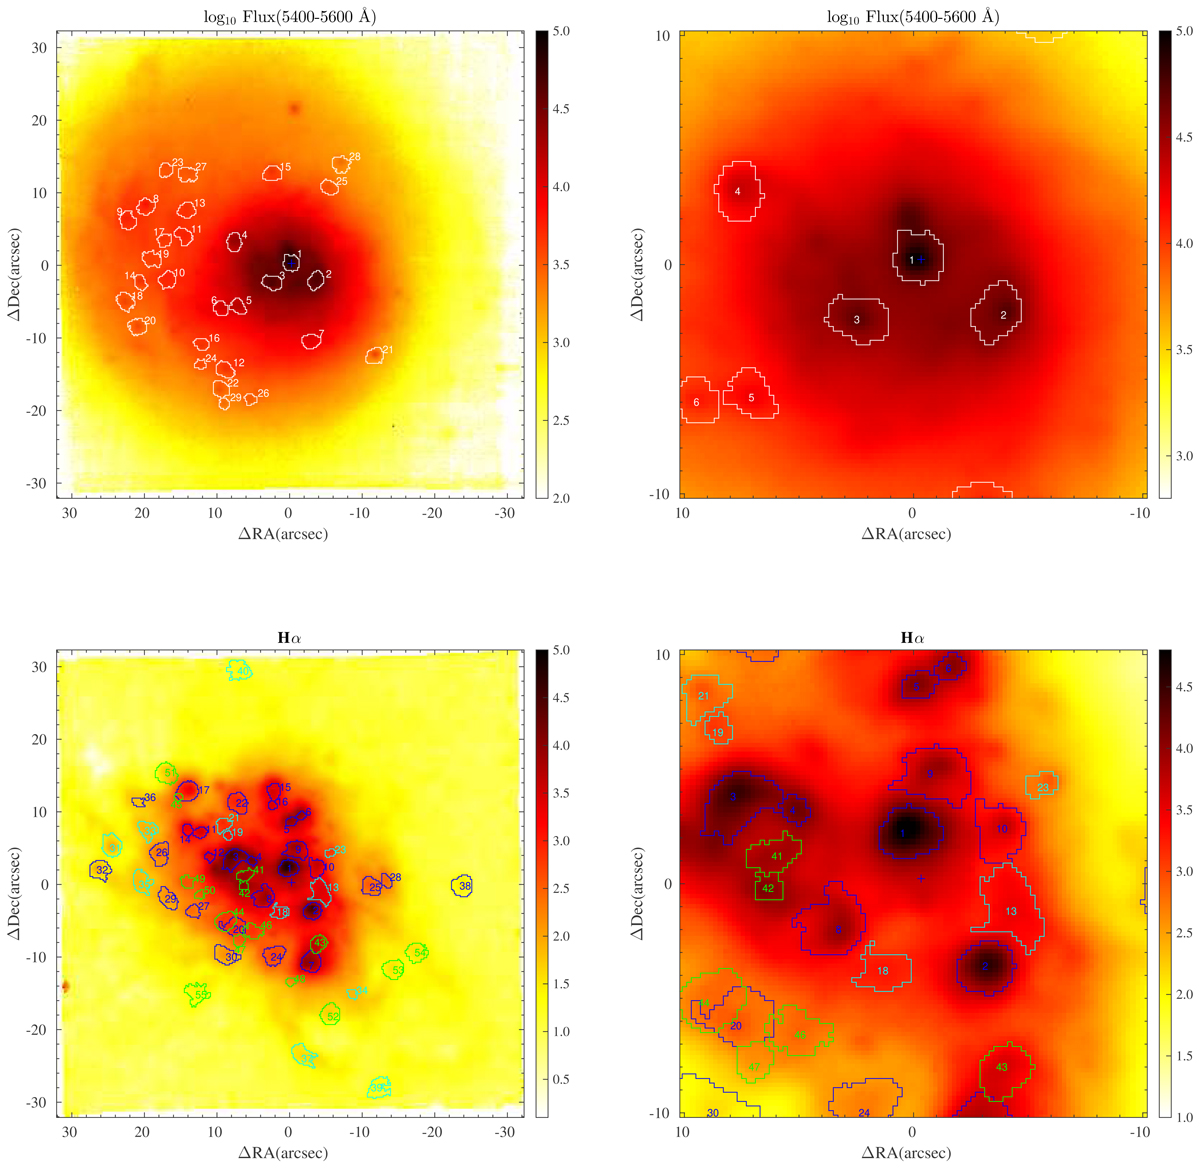
Download original image
Clumps detected in Haro 14. Top-left: the 29 sources (clumps) detected in continuum (see also Table 3) overplotted on the blue (5400–5600 Å) continuum map. There is an evident clustering of the clumps at the galaxy eastern regions. Top-right: zoom into the central 20″ × 20″. The flux units are arbitrary. Bottom-left: the 55 clumps detected in emission lines (see also Table 4) overplotted on the Hα map; sources detected in Hα and [O III] λ5007 appear in blue, sources detected only in Hα in cyan, and those detected only in [O III] λ5007 in green. Bottom-right: zoom into the central galaxy regions. The intensity scale is logarithmic and the cross marks the position of the continuum peak.
Current usage metrics show cumulative count of Article Views (full-text article views including HTML views, PDF and ePub downloads, according to the available data) and Abstracts Views on Vision4Press platform.
Data correspond to usage on the plateform after 2015. The current usage metrics is available 48-96 hours after online publication and is updated daily on week days.
Initial download of the metrics may take a while.