Fig. 2.
Download original image
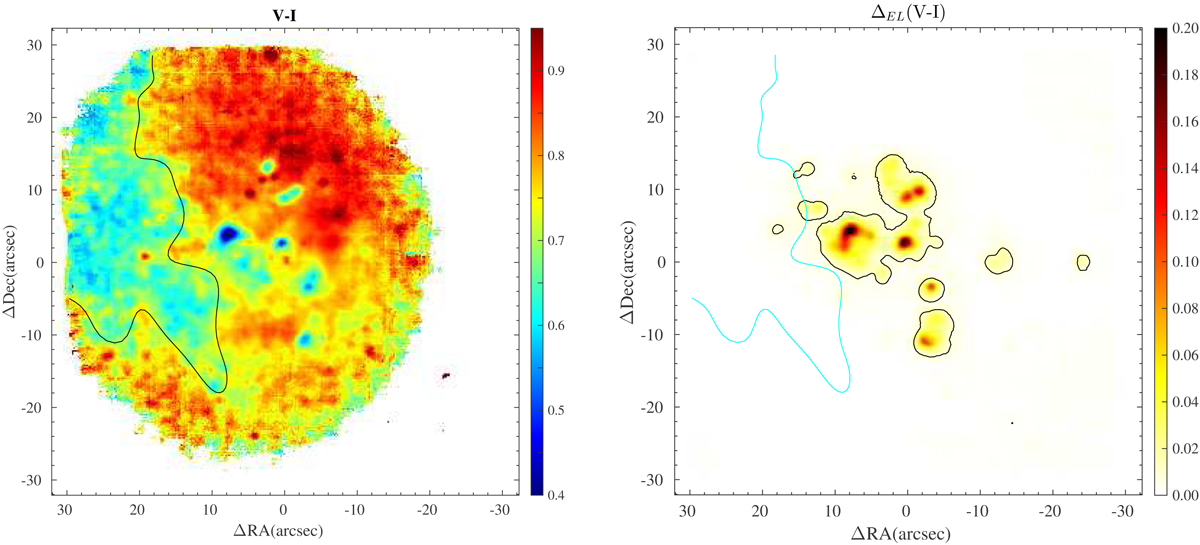
Color spatial pattern in Haro 14. Left: (V − I) color index map; bluer colors indicate the bluer (younger) SF regions and red corresponds to the redder (older) stars in the galaxy. The map is not corrected for the contribution of emission lines. Right: increment in the (V − I) color index due to the contribution of emission lines. The blue line roughly delineates the bluish but not ionizing stellar component unveiled in the color map and the black contour corresponds to ΔL(V − I) = 0.01.
Current usage metrics show cumulative count of Article Views (full-text article views including HTML views, PDF and ePub downloads, according to the available data) and Abstracts Views on Vision4Press platform.
Data correspond to usage on the plateform after 2015. The current usage metrics is available 48-96 hours after online publication and is updated daily on week days.
Initial download of the metrics may take a while.