Fig. 1.
Download original image
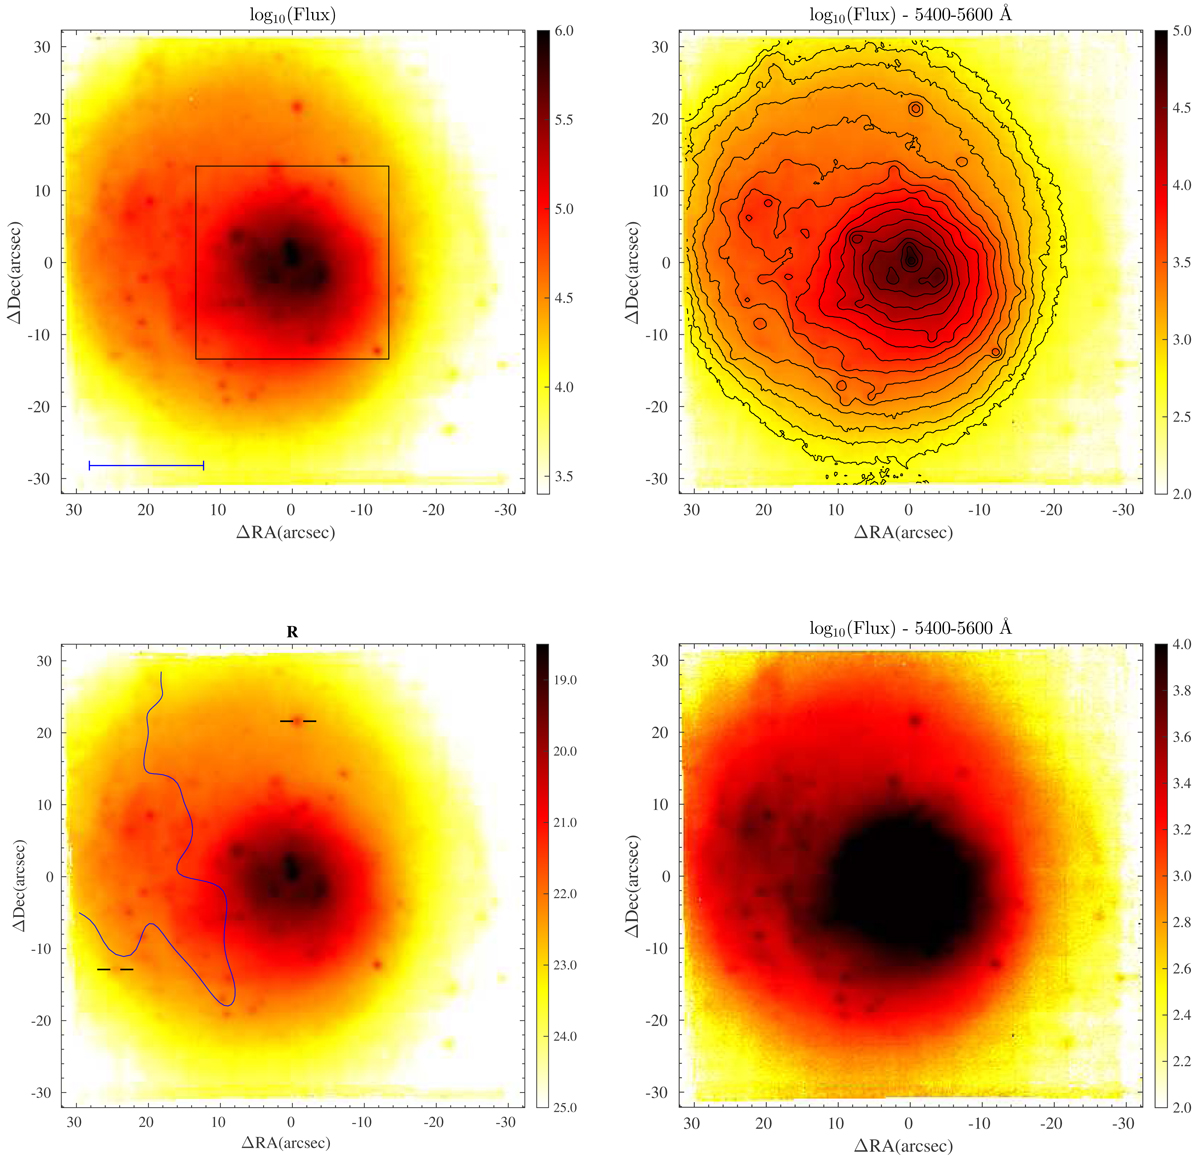
Haro 14 as seen in broadband by MUSE. The FoV is ∼3.8 × 3.8 kpc2 and north is up and east to the left in all the maps presented in this paper. Top-left: image obtained by integrating over the whole observed spectral range. The blue bar corresponds to 1 kpc at the distance of Haro 14. The central square marks the FoV of our previous VIMOS observations. Top-right: “Pure continuum” image in the wavelength range 5400–5600 Å with contours over-plotted. The center of the outermost isophotes lies roughly around the position ΔRA ≃ +5″, ΔDec ≃ +2″. Lower-right: saturated pure continuum image to better visualize the dimmer external parts of the galaxy. Lower-left: synthetic image in the filter R. The color bar shows the calibrated surface brightness in units of mag arcsec−2, the ticks mark the position of two background emission galaxies (see Appendix) and the blue line roughly outlines the bluish regions of the galaxy at intermediate intensity levels (see Sect. 3.3). There are no foreground stars in the observed FoV.
Current usage metrics show cumulative count of Article Views (full-text article views including HTML views, PDF and ePub downloads, according to the available data) and Abstracts Views on Vision4Press platform.
Data correspond to usage on the plateform after 2015. The current usage metrics is available 48-96 hours after online publication and is updated daily on week days.
Initial download of the metrics may take a while.