Fig. 18
Download original image
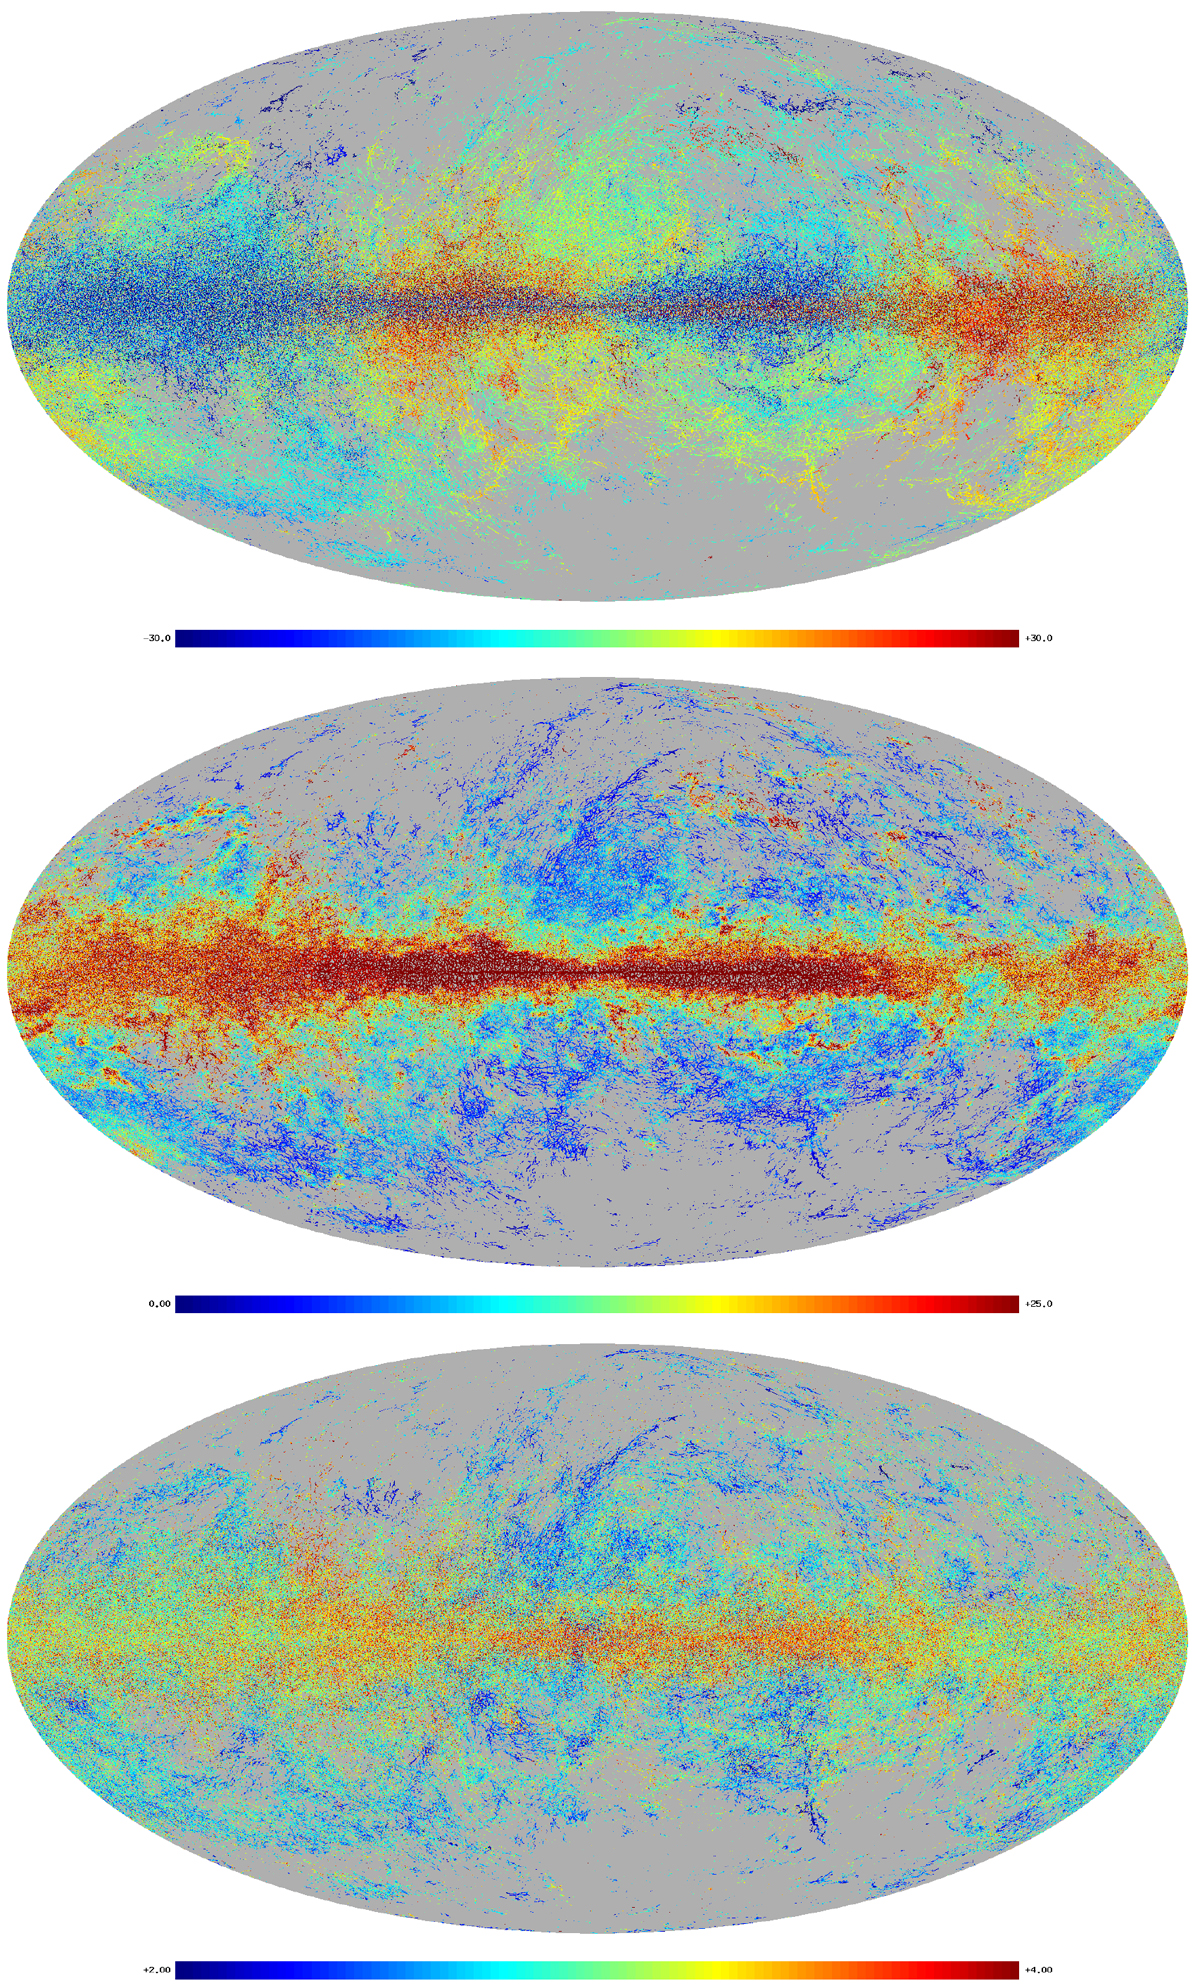
All-sky Mollweide displays of derived H I parameters. Top: velocity distribution for coherent FIR and H I filaments in the velocity range − 30 < vLSR < 30 km s−1. Middle: distribution of the velocity dispersions along filaments for ![]() km s−1. Bottom: spatial distribution of harmonic mean H I Doppler temperatures for 2 < log(TD) < 4.
km s−1. Bottom: spatial distribution of harmonic mean H I Doppler temperatures for 2 < log(TD) < 4.
Current usage metrics show cumulative count of Article Views (full-text article views including HTML views, PDF and ePub downloads, according to the available data) and Abstracts Views on Vision4Press platform.
Data correspond to usage on the plateform after 2015. The current usage metrics is available 48-96 hours after online publication and is updated daily on week days.
Initial download of the metrics may take a while.