Fig. 13
Download original image
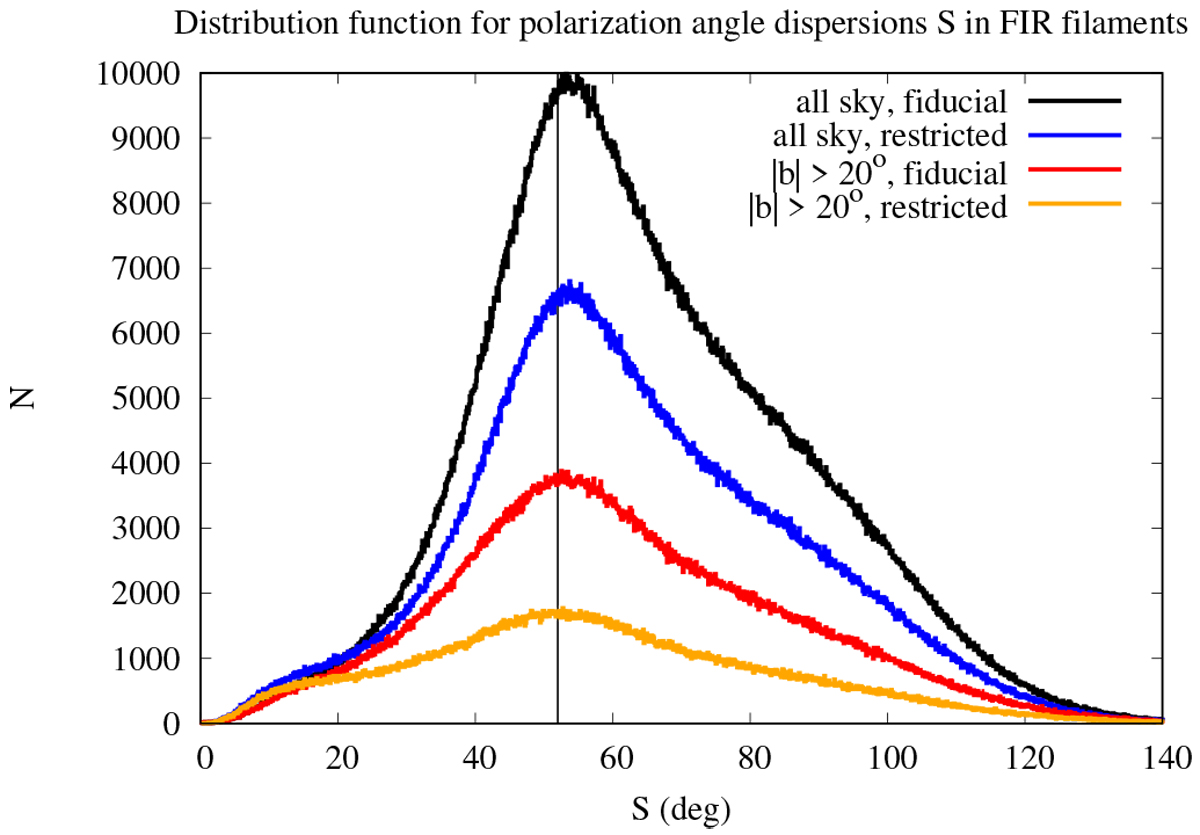
Distribution of the polarization angle dispersion ![]() along FIR filaments at a spatial resolution of 18′. The peak at
along FIR filaments at a spatial resolution of 18′. The peak at ![]() , annotated with a vertical line, indicates that many positions have significant deviations of polarization angles along the filaments. The black and red lines mark filaments with eigenvalues λ− < −1.5 K deg−2, and blue andorange lines represent filaments limited to λ− < −3 K deg−2.
, annotated with a vertical line, indicates that many positions have significant deviations of polarization angles along the filaments. The black and red lines mark filaments with eigenvalues λ− < −1.5 K deg−2, and blue andorange lines represent filaments limited to λ− < −3 K deg−2.
Current usage metrics show cumulative count of Article Views (full-text article views including HTML views, PDF and ePub downloads, according to the available data) and Abstracts Views on Vision4Press platform.
Data correspond to usage on the plateform after 2015. The current usage metrics is available 48-96 hours after online publication and is updated daily on week days.
Initial download of the metrics may take a while.