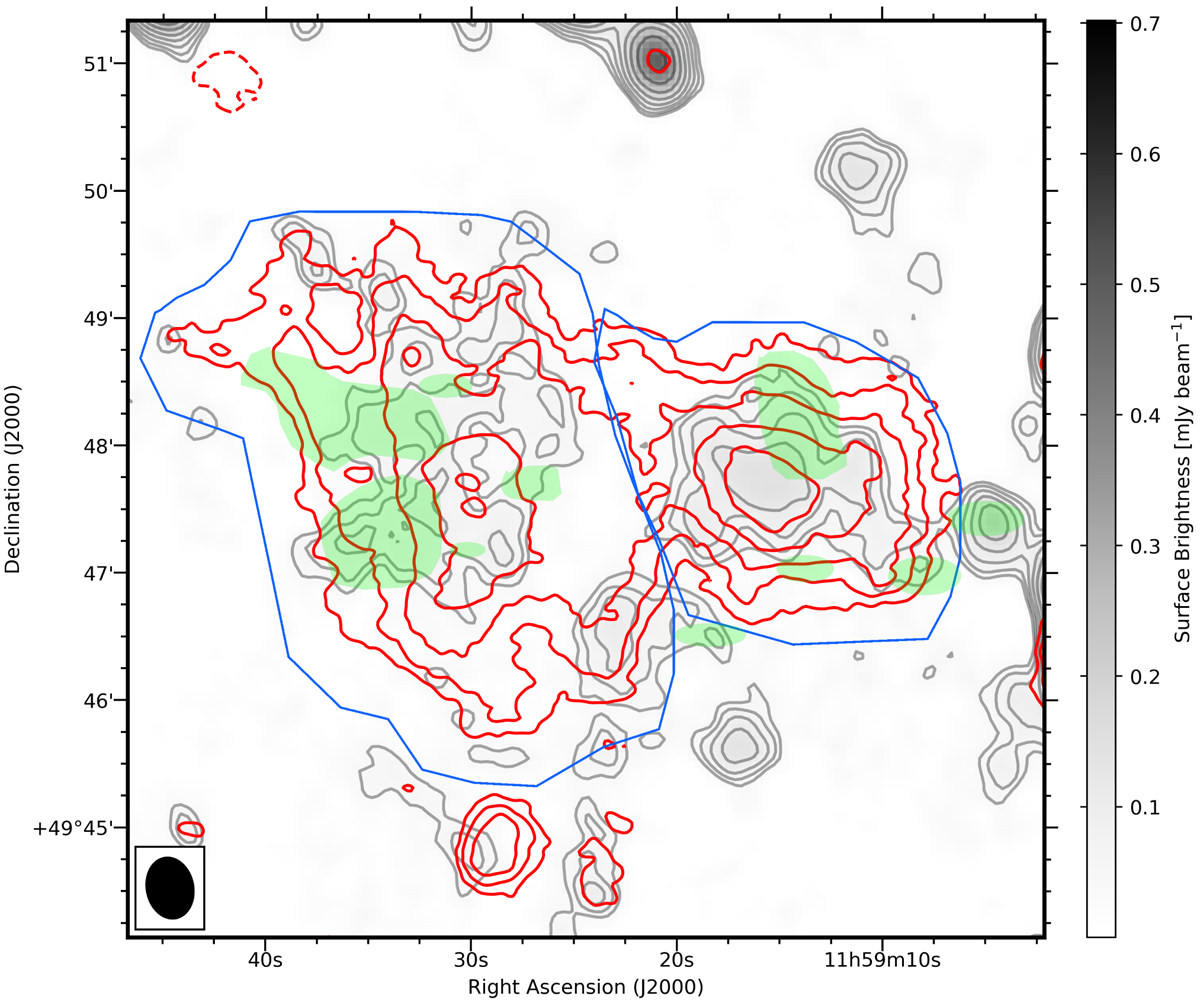
Fig. 8.
Download original image
Total power low-resolution radio map of A1430. Greyscale: VLA image using Briggs weighting +0.6 with sources subtracted. The noise level is σrms = 13 μJy beam−1, with a restoring beam of 29″ × 22″ and a position angle of 14°. Red contours: LOFAR HBA image and contours as in Fig. 7. Negative contour lines are drawn with dashed lines. Blue lines: regions to indicate which diffuse emission is considered to be part of each component of the cluster. Green areas: regions where compact and extended sources have been subtracted in the uv-plane for both the VLA and the LOFAR image.
Current usage metrics show cumulative count of Article Views (full-text article views including HTML views, PDF and ePub downloads, according to the available data) and Abstracts Views on Vision4Press platform.
Data correspond to usage on the plateform after 2015. The current usage metrics is available 48-96 hours after online publication and is updated daily on week days.
Initial download of the metrics may take a while.