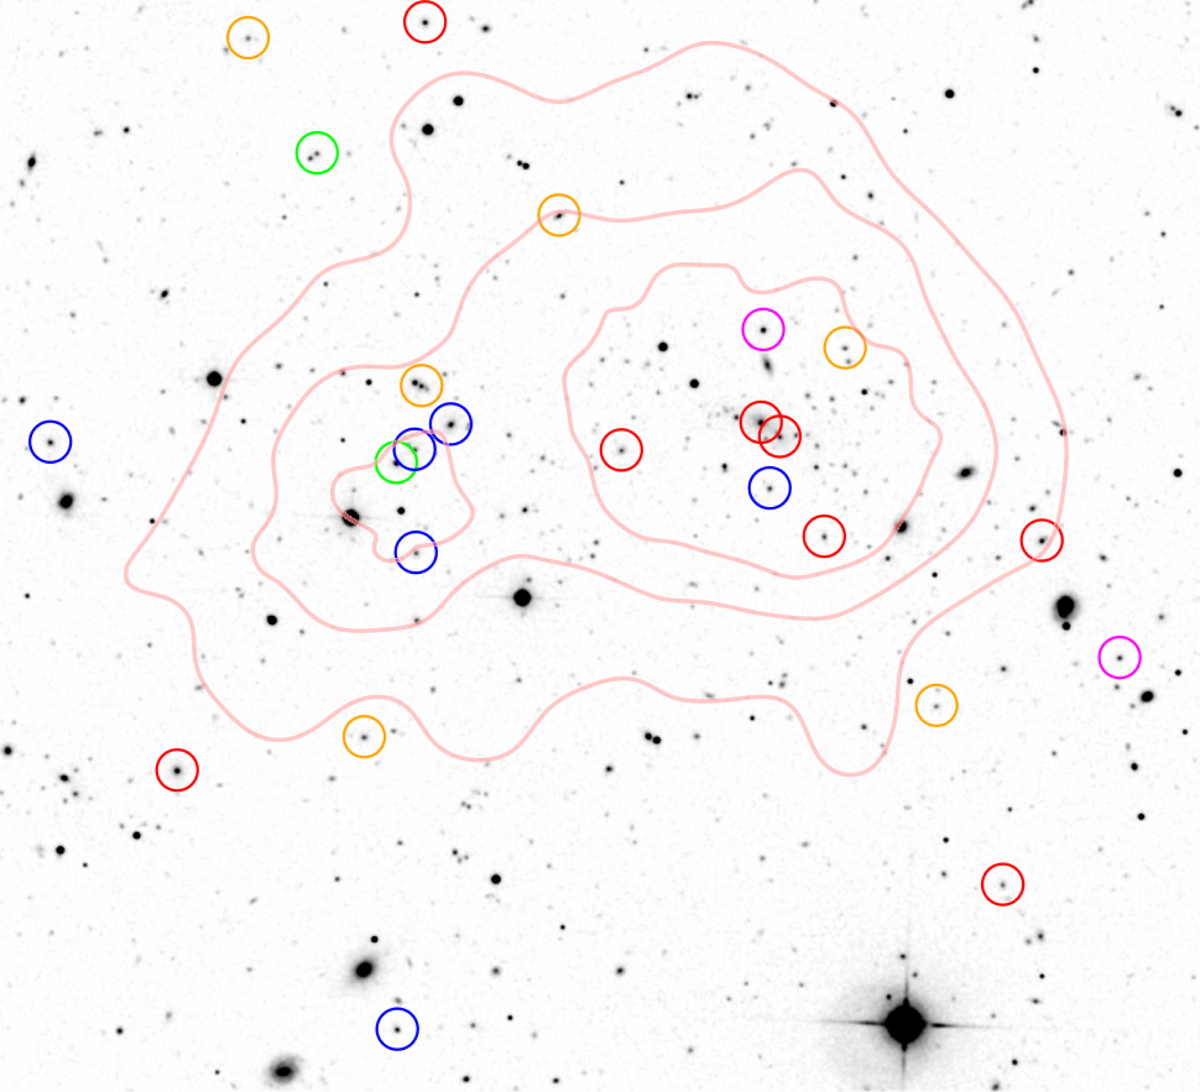
Fig. 6.
Download original image
Greyscale: SDSS r-band image of the A1430 field with galaxies encircled having a spectroscopic redshift close to the cluster redshift. The main cluster component and the subcomponent are, on average, separated in redshift. The colours mark different redshift intervals corresponding to the discussion in Sect. 4.4: 0.338−0.341 (green), 0.341−0.347 (blue), 0.347−0.348 (magenta), 0.348−0.352 (red), and 0.352−0.358 (orange). Pale red contours represent the distribution of X-ray emission as seen by Chandra to indicate the cluster position.
Current usage metrics show cumulative count of Article Views (full-text article views including HTML views, PDF and ePub downloads, according to the available data) and Abstracts Views on Vision4Press platform.
Data correspond to usage on the plateform after 2015. The current usage metrics is available 48-96 hours after online publication and is updated daily on week days.
Initial download of the metrics may take a while.