Fig. 12.
Download original image
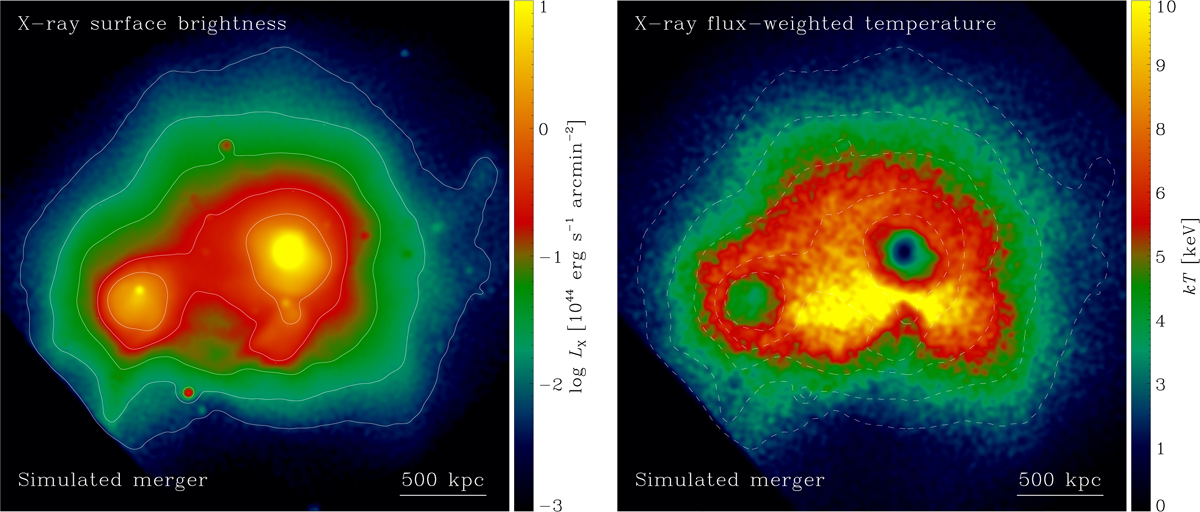
Example of a simulated cluster merger candidate chosen to match observed A1430’s properties smoothed with a Gaussian of 3″ width. Left panel: X-ray surface brightness distribution. Merging clusters are clearly seen as two distinct peaks. Solid contours indicate logarithmic X-ray surface brightness levels of 42, 42.5, 43, 43.5, and 44 in units of erg s−1 arcmin−2. Right panel: X-ray flux-weighted temperature. For comparison, surface brightness contours are also shown as dashed lines. Gas temperature increases between the clusters as a result of the interaction.
Current usage metrics show cumulative count of Article Views (full-text article views including HTML views, PDF and ePub downloads, according to the available data) and Abstracts Views on Vision4Press platform.
Data correspond to usage on the plateform after 2015. The current usage metrics is available 48-96 hours after online publication and is updated daily on week days.
Initial download of the metrics may take a while.