Fig. 4.
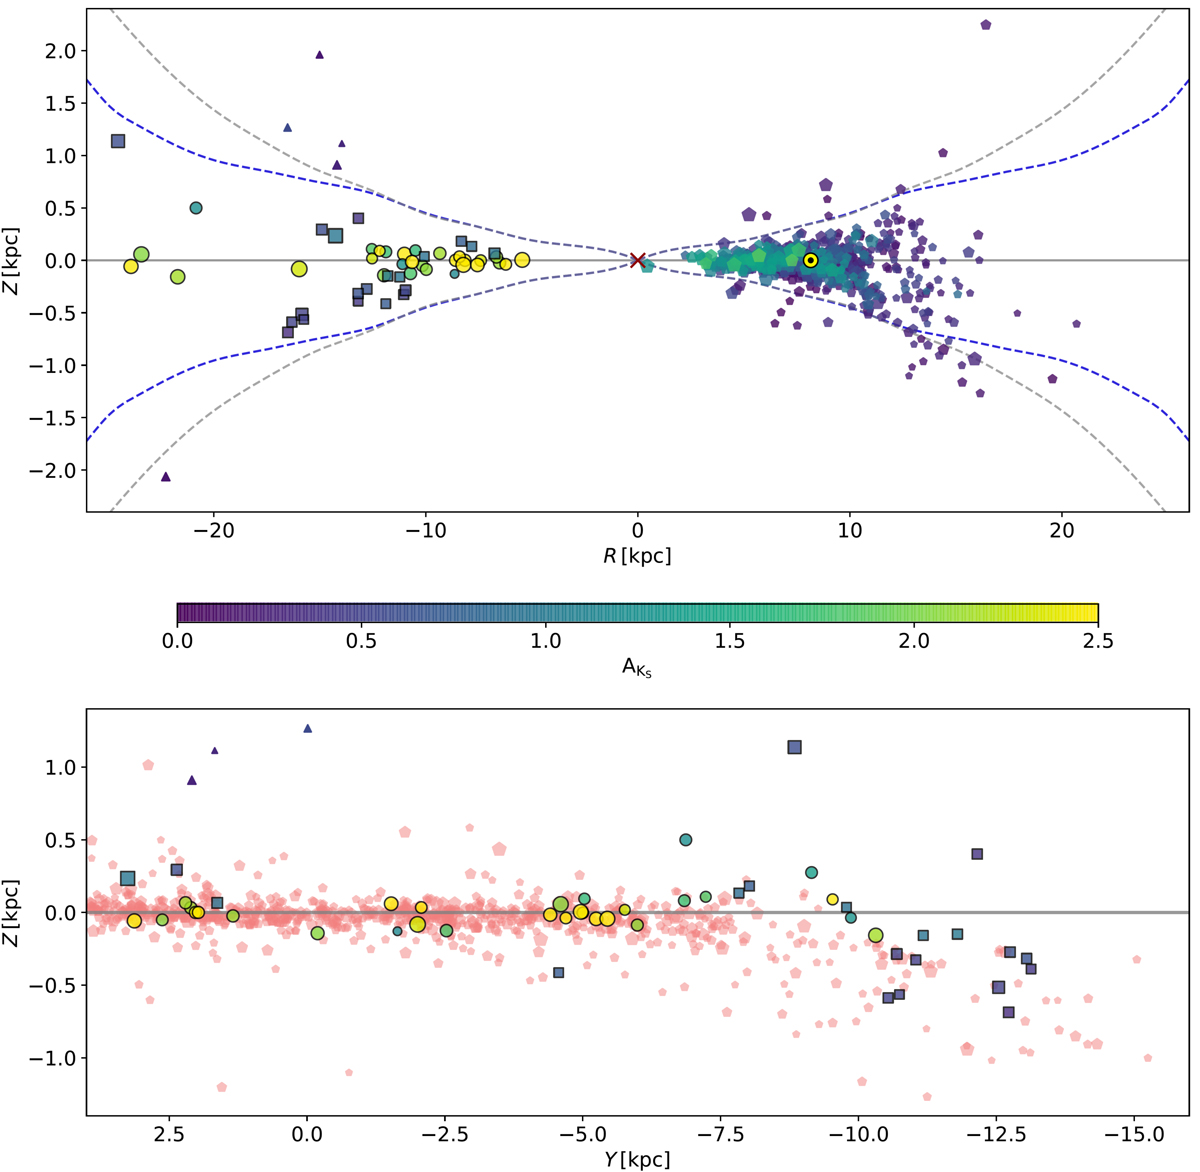
Download original image
Vertical distribution of our sample of far side disk CCs, compared to other well-known CCs from the literature. Top: galactocentric radius (R) versus Z distribution for CCs, color coded by their KS extinctions, AKS. At positive R values, we plotted the CCs from Skowron et al. (2019a) that are on the near side of the Galactic disk, i.e., at X < 8.15 kpc (pentagons), while the CCs used in this work are shown at R < 0 (circles and squares are used as in Fig. 1). The sizes of the symbols are inversely proportional to the CC ages. The five CCs from Feast et al. (2014) are included here as a reference (triangles), as well as the flaring curve models from Kalberla et al. (2007), where the blue and gray dashed lines represent their S and N1 models, respectively. Bottom: projection of our CCs in Galactic Y versus Z coordinates. The whole sample of stars from Skowron et al. (2019b) with a period larger than five days is now plotted as background pink pentagons. The warped shape of the southern disk toward negative Z values is clear in this plot.
Current usage metrics show cumulative count of Article Views (full-text article views including HTML views, PDF and ePub downloads, according to the available data) and Abstracts Views on Vision4Press platform.
Data correspond to usage on the plateform after 2015. The current usage metrics is available 48-96 hours after online publication and is updated daily on week days.
Initial download of the metrics may take a while.