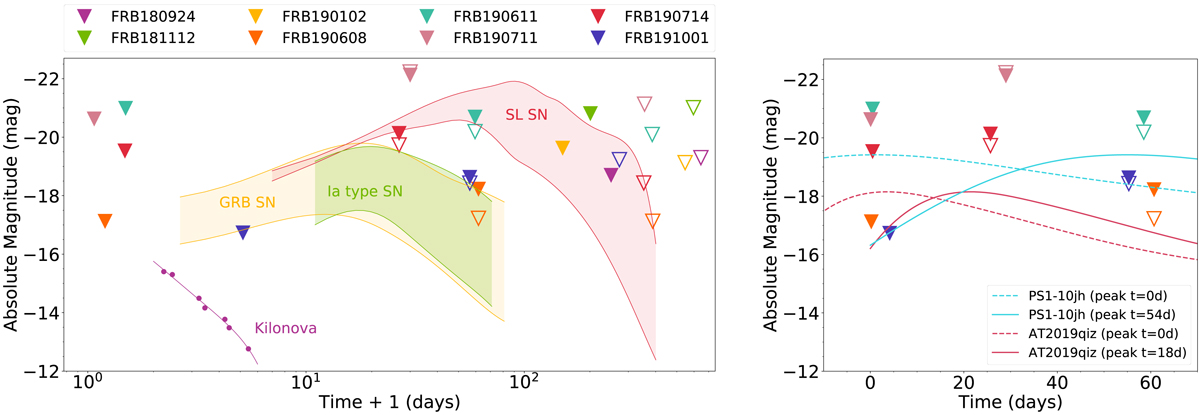
Fig. 3.
Download original image
Limiting absolute magnitudes at different epochs obtained for FRB positions (triangles) and light curves of different bright optical transients (colored lines and regions). Filled and open triangles correspond to the limit that uses the last and the first epoch as a template, respectively. Left panel: light-curve bands (see Sect. 4.1) for SLSNe (red), GRB-SNe (yellow), and SNe Ia (green). The light curve of the optical counterpart to a kilonova (GW170817) is also shown (purple). For the limiting magnitudes, the x axis corresponds to the time since the FRB signal was received on Earth; for the light curves, the x axis corresponds to the time since explosion. We emphasize that the x axis is shown on a logarithmic scale (+1 day for convenience) and that the y axis is on the astronomical magnitude scale, such that brighter objects are at the top. Right panel: representative TDE light curves (PS1-10jh in cyan, AT2019qiz in pink) with luminosity peak times coinciding with the FRB arrival time (dashed lines) and with t = 54 and t = 18 days (solid lines) after the FRB arrival time. Here the x axis is presented in linear scale.
Current usage metrics show cumulative count of Article Views (full-text article views including HTML views, PDF and ePub downloads, according to the available data) and Abstracts Views on Vision4Press platform.
Data correspond to usage on the plateform after 2015. The current usage metrics is available 48-96 hours after online publication and is updated daily on week days.
Initial download of the metrics may take a while.