Fig. 1.
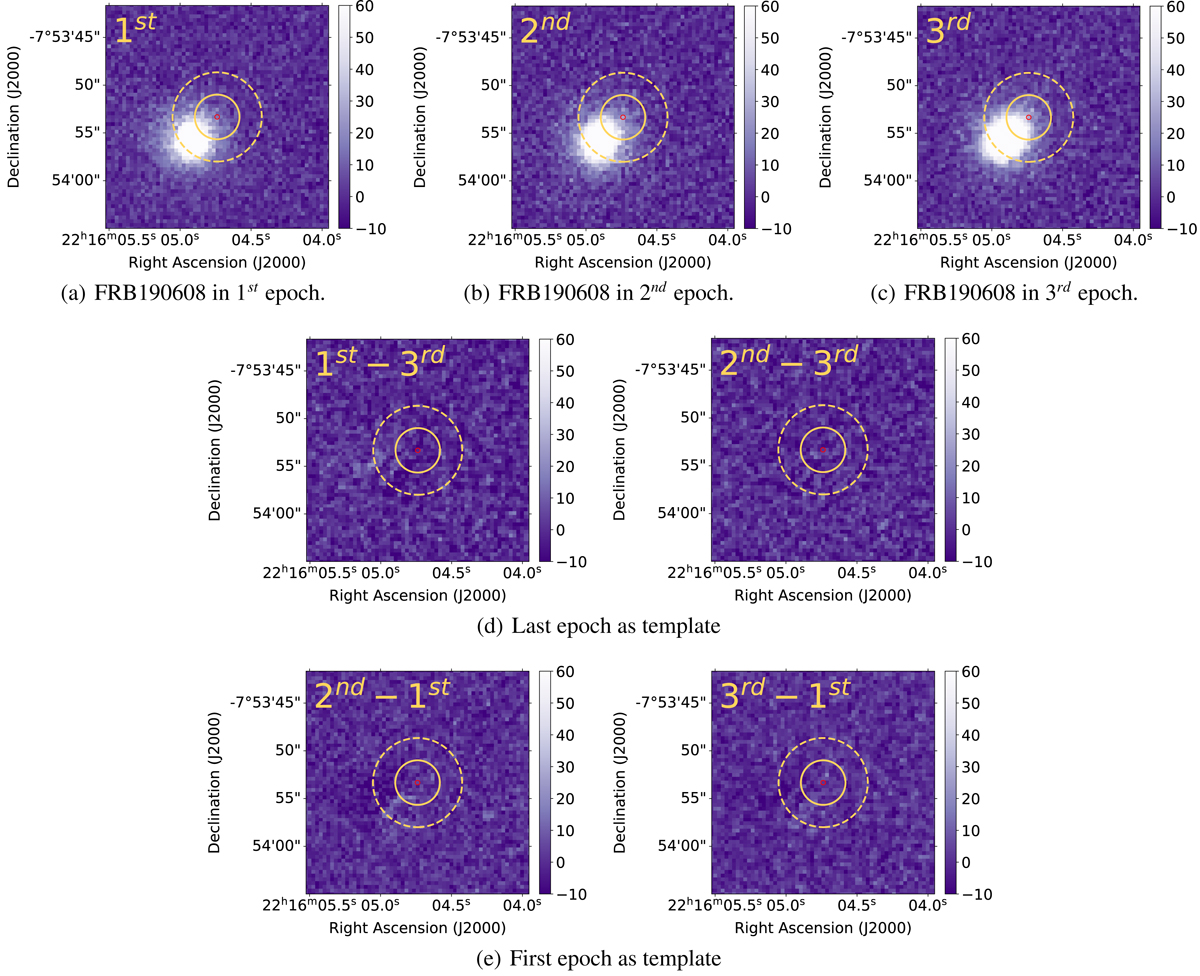
Download original image
Example of difference images for FRB190608. Panels a–c: correspond to the images of each epoch of the FRB190608 observations (three epochs in total for this FRB). Panels d,e: difference images using the image of the last (3) and first (1) epoch as a template, respectively. The solid and dashed circles in all the panels represent the aperture radius of one and two times the FWHM, respectively, as reference, where FWHM = ∼2.3″. Our photometric analysis uses an aperture radius of two times the FWHM to set the non-detection limiting magnitudes. The red ellipse represents the uncertainty in the FRB position.
Current usage metrics show cumulative count of Article Views (full-text article views including HTML views, PDF and ePub downloads, according to the available data) and Abstracts Views on Vision4Press platform.
Data correspond to usage on the plateform after 2015. The current usage metrics is available 48-96 hours after online publication and is updated daily on week days.
Initial download of the metrics may take a while.