Fig. 8
Download original image
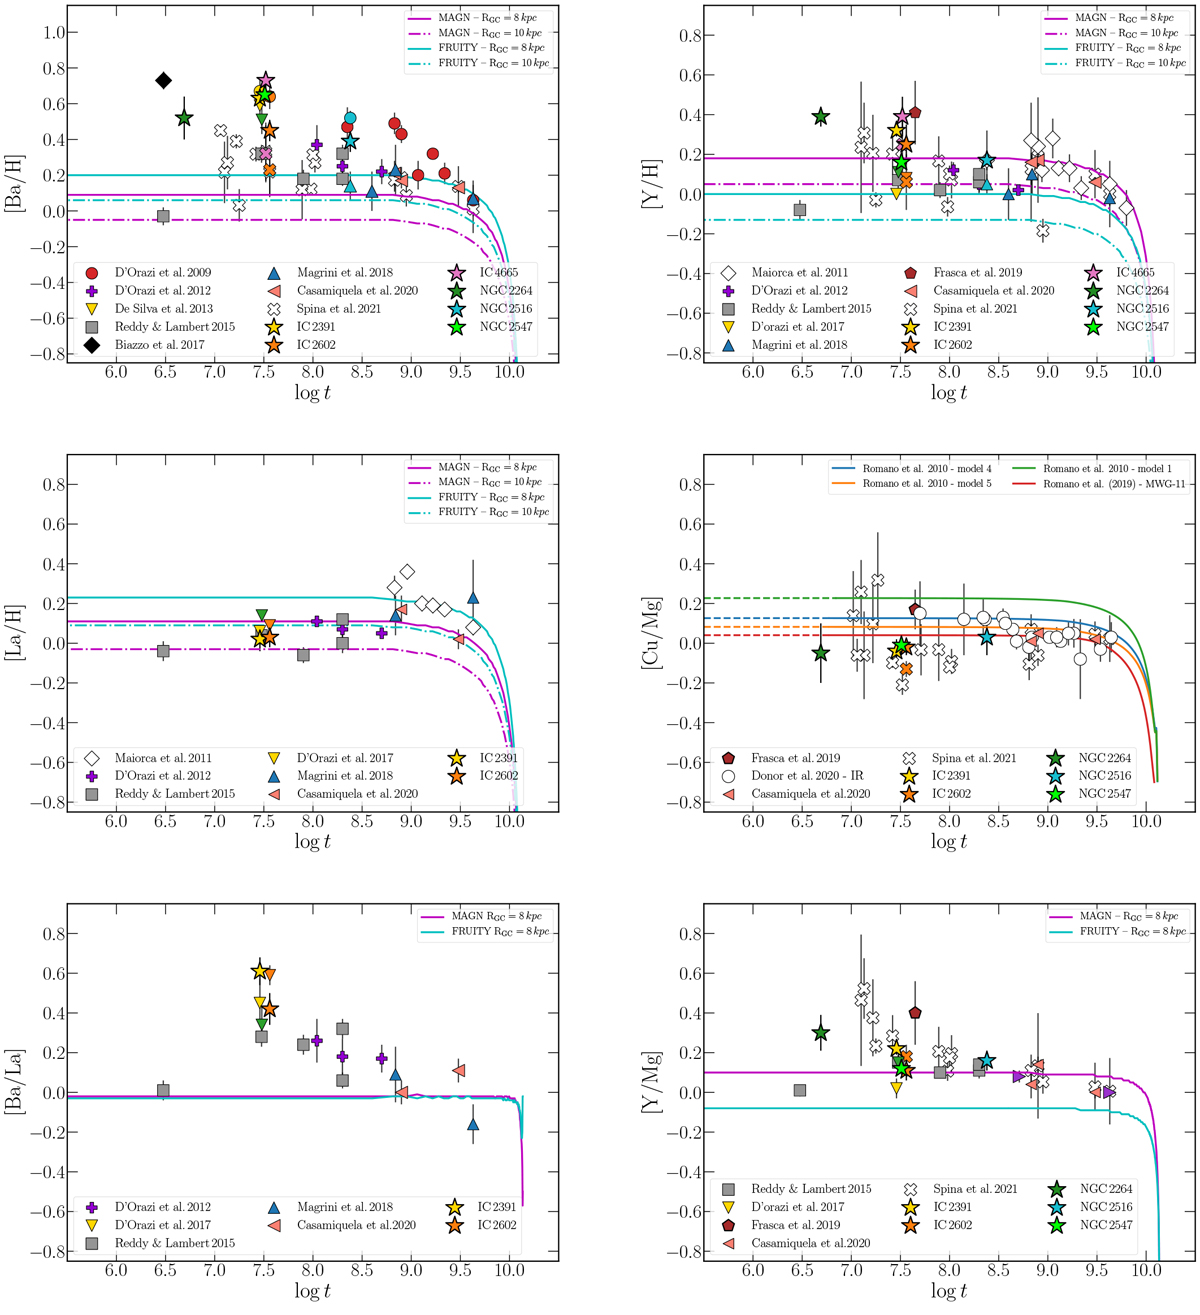
[Ba/H] (top left panel), [Y/H] (top right panel), [La/H] (centre left panel), [Cu/Mg] (centre right panel), [Ba/La] (bottom left panel), and [Y/Mg] (bottom right panel) as a function of the age of Galactic open clusters with 7.5 < RGC< 9 kpc. The cluster symbols are the same as in Fig. 7. The cyan and magenta lines are the GCE models described in Magrini et al. (2021) with the MAGN stellar yields (Vescovi et al. 2020; continuous curves) and FRUITY (Cristallo et al. 2009; dot-dashed curves). In the [Cu/Mg] vs. log t the models from Romano et al. (2010) with different stellar yields are considered: model 1 (green curve) with the Woosley & Weaver (1995) yields, model 5 with yields from Kobayashi et al. (2006) with (orange line) or model 4 without (blue line) hypernovae contribution, and Romano et al. (2019) (red line) with yields from Limongi & Chieffi (2018). See the text for further details.
Current usage metrics show cumulative count of Article Views (full-text article views including HTML views, PDF and ePub downloads, according to the available data) and Abstracts Views on Vision4Press platform.
Data correspond to usage on the plateform after 2015. The current usage metrics is available 48-96 hours after online publication and is updated daily on week days.
Initial download of the metrics may take a while.