Fig. 2
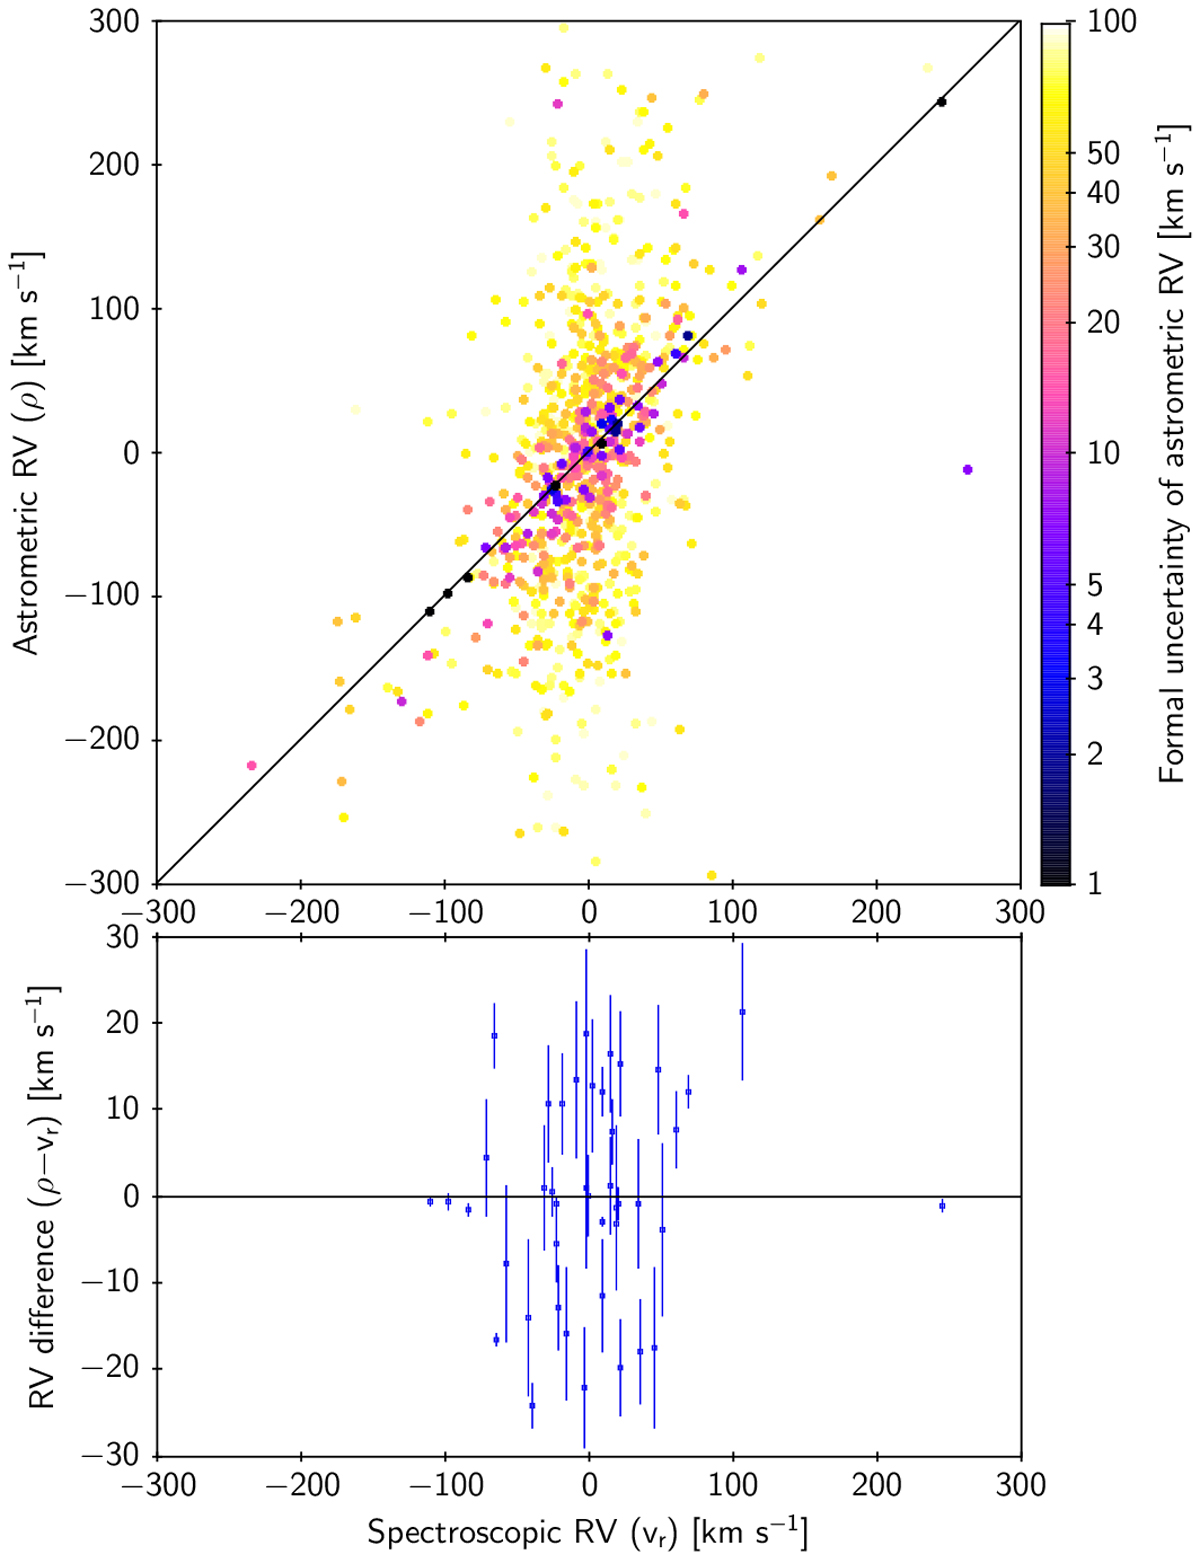
Comparison of the astrometric and spectroscopic radial velocities. Top: astrometric versus spectroscopic values for the sample shown as the dark blue histogram in Fig. 1 and colour-coded according to the formal uncertainty (σρ) of the astrometric radial velocity estimate. The black line is the 1:1 relation. There are 28 data points that fall outside the limits ofthis plot. Bottom: difference between the astrometric and spectroscopic velocities for the sub-sample with σρ < 10 km s−1 (corresponding to Table 1), with error bars at ±σρ. There are 11 data points outside of this plot.
Current usage metrics show cumulative count of Article Views (full-text article views including HTML views, PDF and ePub downloads, according to the available data) and Abstracts Views on Vision4Press platform.
Data correspond to usage on the plateform after 2015. The current usage metrics is available 48-96 hours after online publication and is updated daily on week days.
Initial download of the metrics may take a while.