Fig. 7.
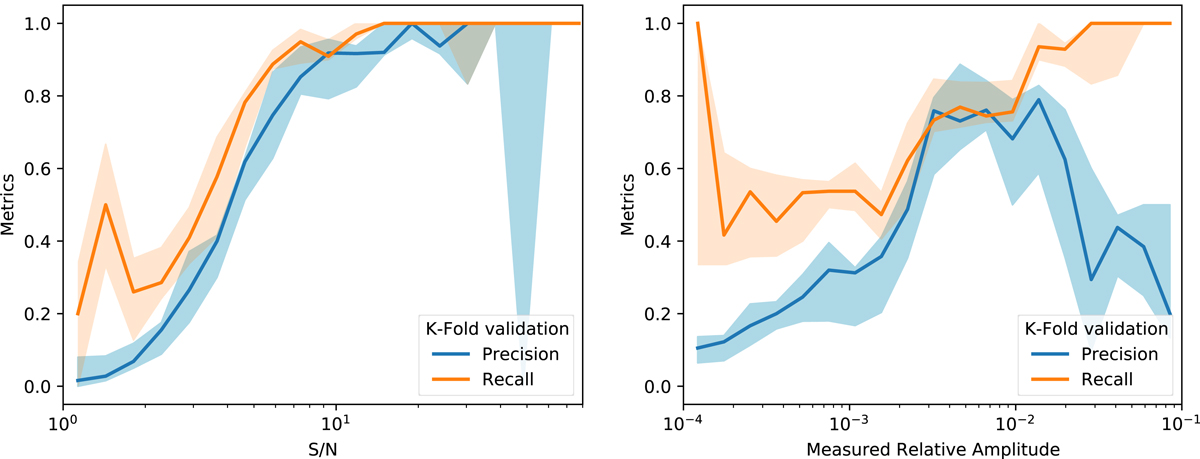
K-fold cross-validation on the independent test data set. The curves show the precision (blue) and recall (orange) as a function of flare S/N (left) and relative amplitude (right). The raw predictions were median filtered with a window length of 47. Points above a probability of 0.2 are considered to be flares. Above the 3−5σ signal level, the uncertainty of the models as a result of different training sets is reduced to a few percent, suggesting that the trained model is robust, and that the training sets are sufficiently large. We note the logarithmic abscissa. The low precision in the right plot is caused by the very low number of events.
Current usage metrics show cumulative count of Article Views (full-text article views including HTML views, PDF and ePub downloads, according to the available data) and Abstracts Views on Vision4Press platform.
Data correspond to usage on the plateform after 2015. The current usage metrics is available 48-96 hours after online publication and is updated daily on week days.
Initial download of the metrics may take a while.