Fig. 5.
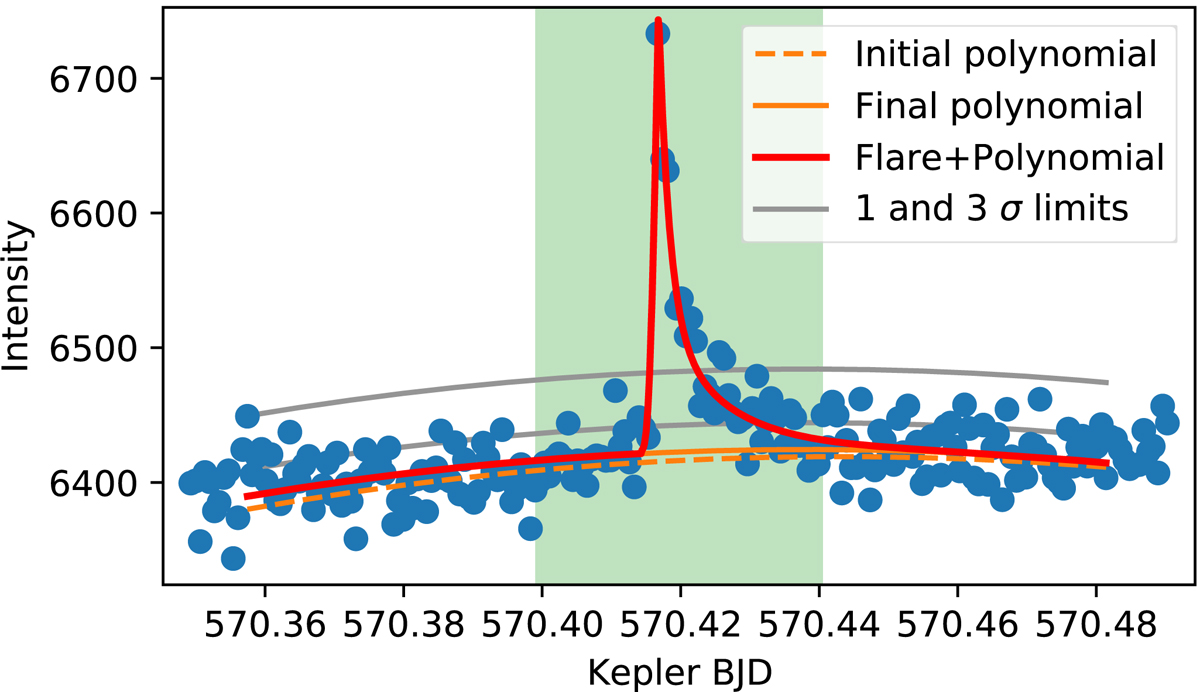
Example for the validation. The green area shows the section marked as a probable flare. Additional flare-length windows before and after the marked region are selected, and fitted by a low-order polynomial. The fit is subtracted from the light curve, and the residual is fitted by another low-order polynomial and an analytical flare model. If the peak of the fit is above the 3σ noise level, the event is marked as validated.
Current usage metrics show cumulative count of Article Views (full-text article views including HTML views, PDF and ePub downloads, according to the available data) and Abstracts Views on Vision4Press platform.
Data correspond to usage on the plateform after 2015. The current usage metrics is available 48-96 hours after online publication and is updated daily on week days.
Initial download of the metrics may take a while.