Fig. 4.
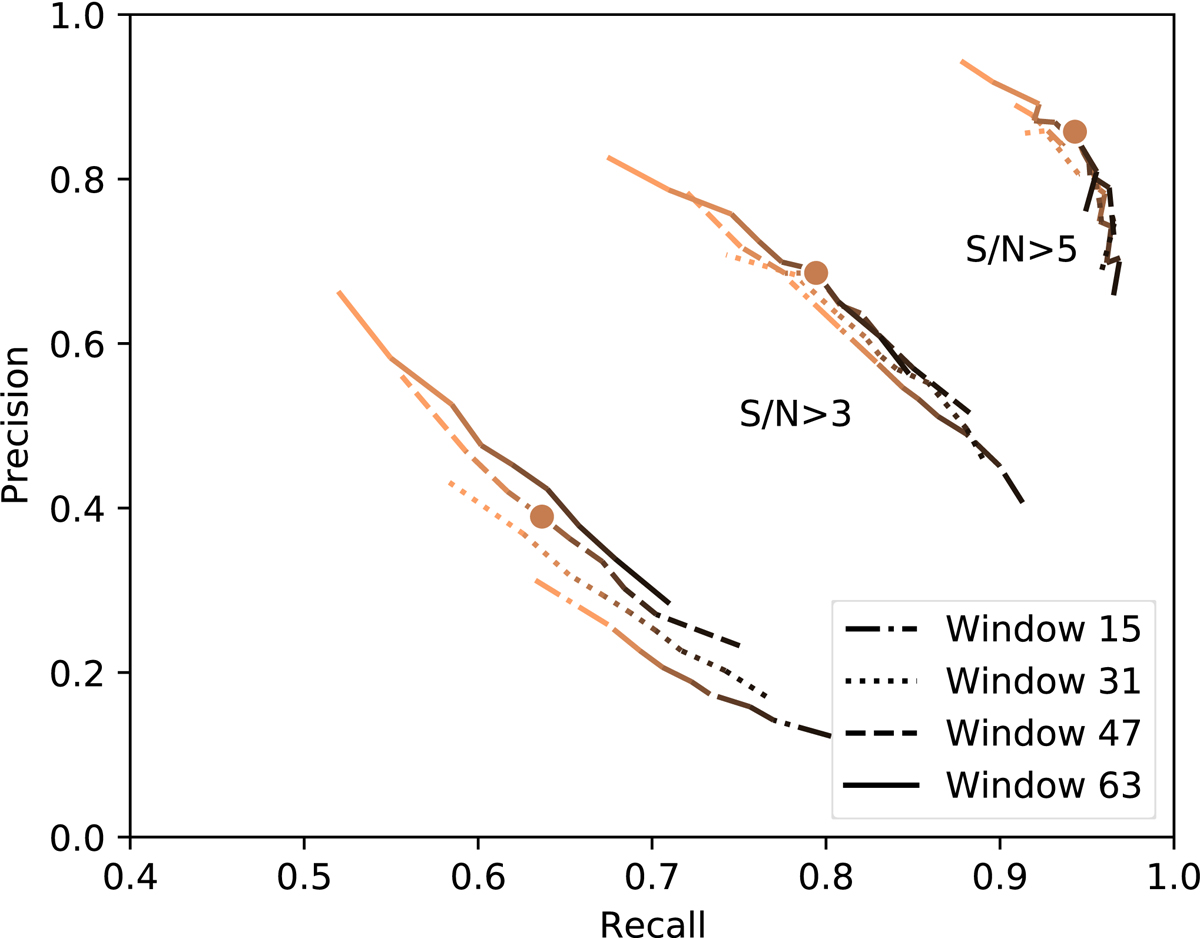
Precision–recall curve with median filters of different kernel sizes. The three batches show all flare events from the test data (left), and cases with flares in which the highest point compared to the noise in the light curve is above 3σ (middle) and 5σ (right). The color coding shows different cutoff levels above which a flux measurement is considered to be a flare. The darker the color the higher the cutoff threshold. The point marks the location of a cutoff value of 0.2 for the 47-point-width median filtered case. See text for details.
Current usage metrics show cumulative count of Article Views (full-text article views including HTML views, PDF and ePub downloads, according to the available data) and Abstracts Views on Vision4Press platform.
Data correspond to usage on the plateform after 2015. The current usage metrics is available 48-96 hours after online publication and is updated daily on week days.
Initial download of the metrics may take a while.