Fig. 6.
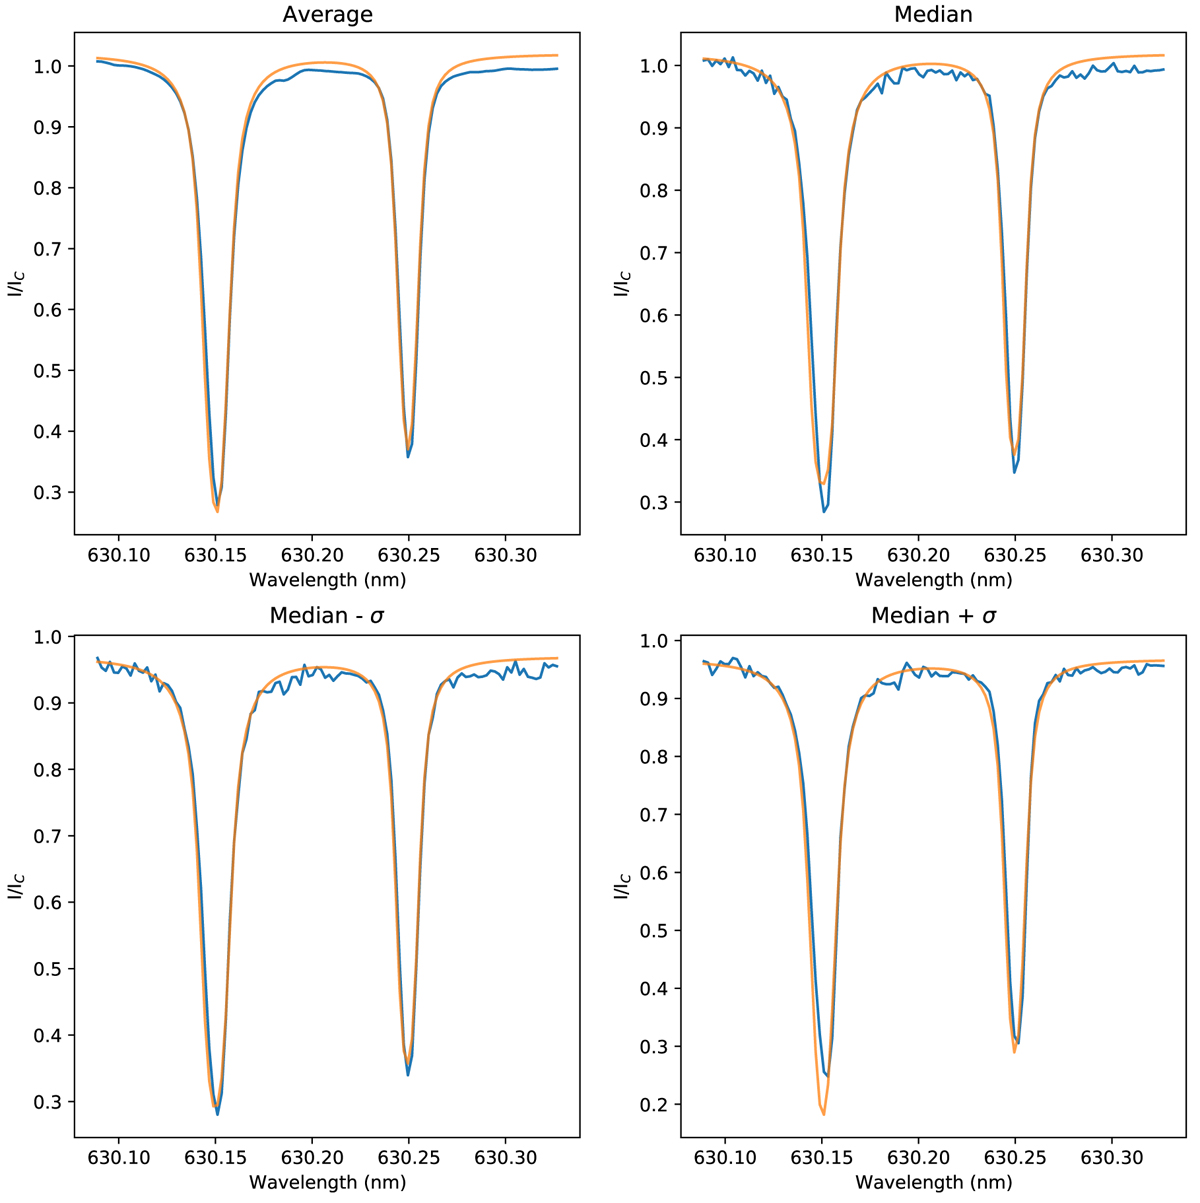
Upper left: average observed and synthetic profiles in the region. Upper right: sample profiles where the χ2 is equal to the median in the region. Lower left: profiles representative of a good reconstructed fit, where the χ2 is equal to the median minus one standard deviation. Lower right: profiles representative of a poor reconstructed fit, where the χ2 is equal to the median plus one standard deviation. In all cases, the profile in blue is the observation and orange is the synthesis from the reconstructed model atmosphere (reconstructed fit).
Current usage metrics show cumulative count of Article Views (full-text article views including HTML views, PDF and ePub downloads, according to the available data) and Abstracts Views on Vision4Press platform.
Data correspond to usage on the plateform after 2015. The current usage metrics is available 48-96 hours after online publication and is updated daily on week days.
Initial download of the metrics may take a while.