Fig. 14.
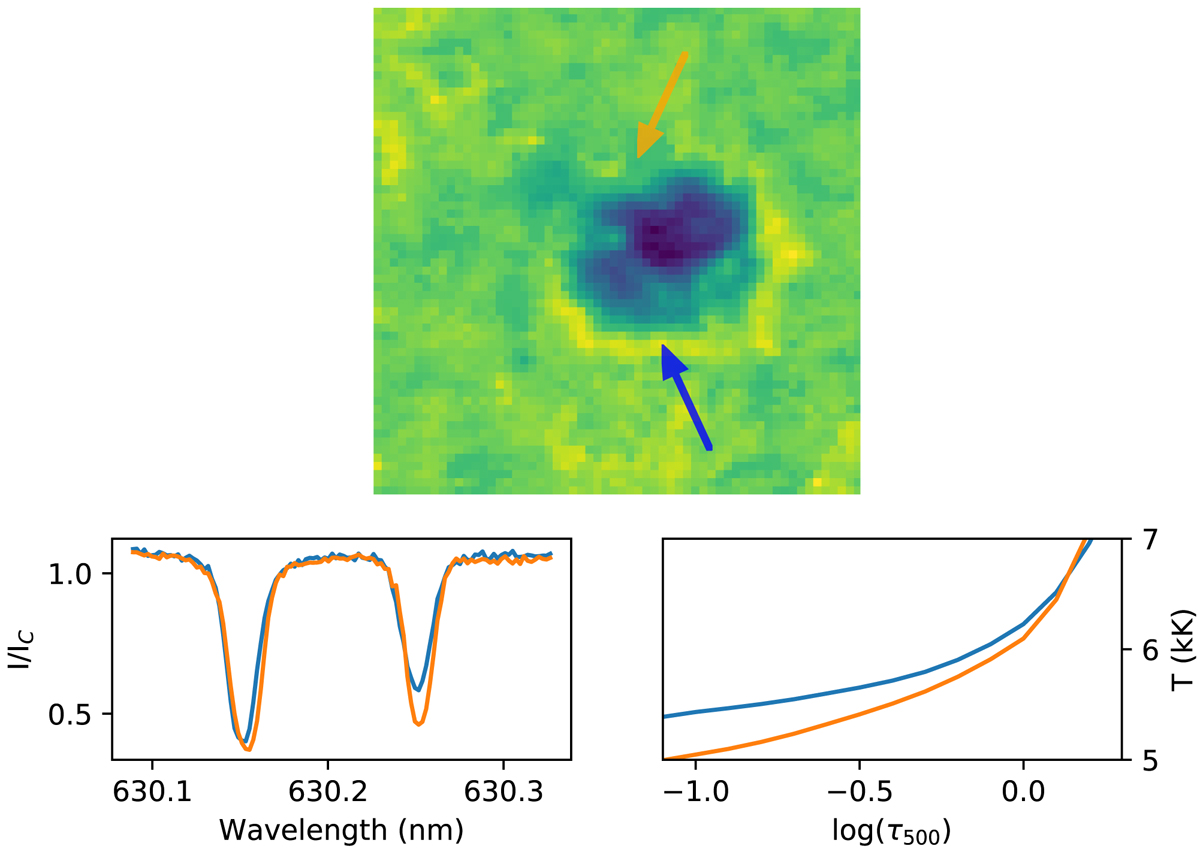
NICOLE inversions of two spectra observed at a pore boundary, one being in the hot wall (blue line) and the other on the opposite side (orange line). Upper panel: location of the pixels subject to inversion. Lower left: observed profiles in the hot wall (blue) and the opposite side (orange). Lower right: temperature stratification produced by NICOLE for the hot wall (blue) and the opposite side (orange) spectra.
Current usage metrics show cumulative count of Article Views (full-text article views including HTML views, PDF and ePub downloads, according to the available data) and Abstracts Views on Vision4Press platform.
Data correspond to usage on the plateform after 2015. The current usage metrics is available 48-96 hours after online publication and is updated daily on week days.
Initial download of the metrics may take a while.