Fig. 12.
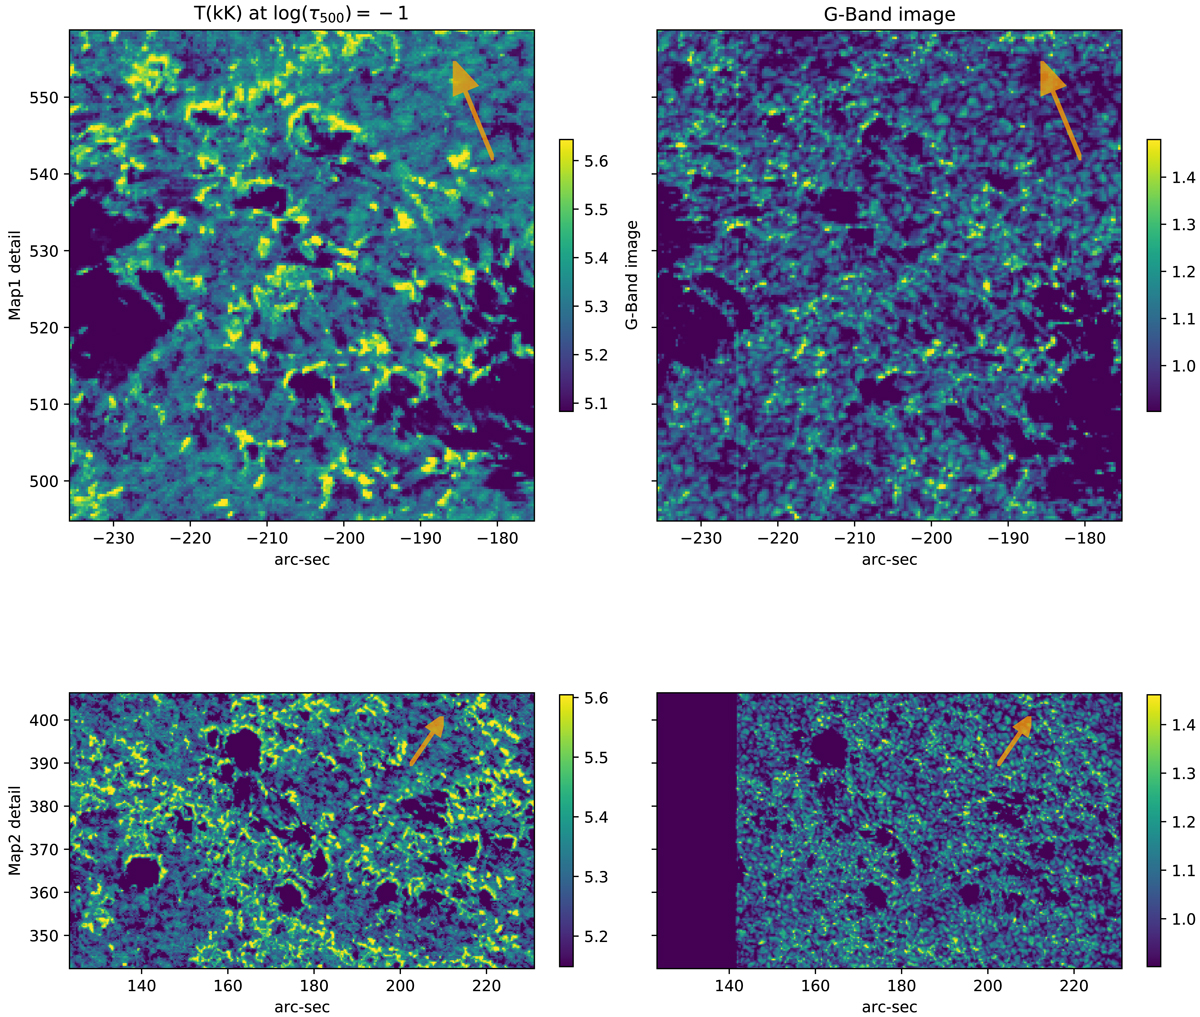
Enlargement of the areas with pores in the active regions map1 (upper panels) and map2 (lower panels). The left panels show ANN temperature reconstructions at log τ500 = −1 and the right panels, the respective G-band filtergrams. Notice the bright arcs around the limb-side (indicated by the orange arrow) of the pores in the left panels.
Current usage metrics show cumulative count of Article Views (full-text article views including HTML views, PDF and ePub downloads, according to the available data) and Abstracts Views on Vision4Press platform.
Data correspond to usage on the plateform after 2015. The current usage metrics is available 48-96 hours after online publication and is updated daily on week days.
Initial download of the metrics may take a while.