Fig. 5.
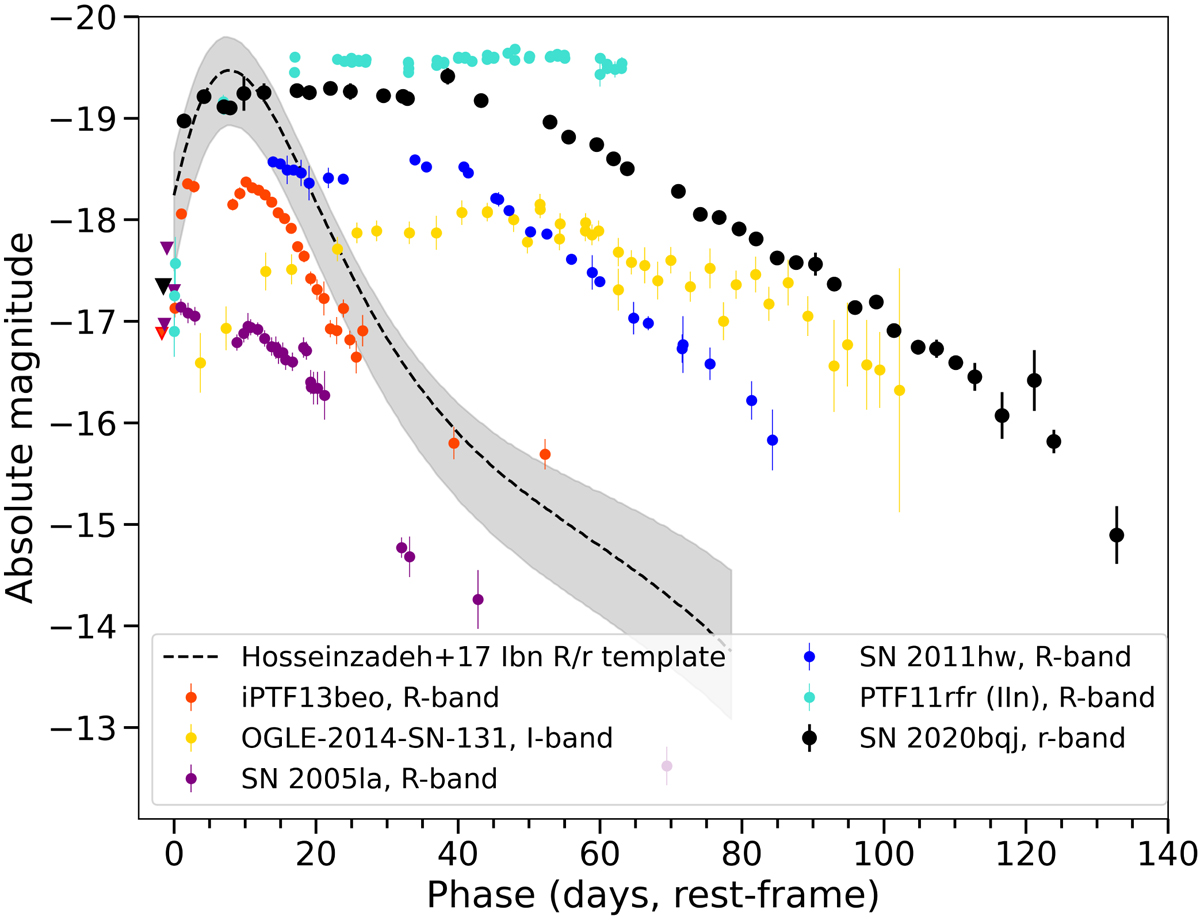
Type Ibn R/r-band template lightcurve from Hosseinzadeh et al. (2017), with overplotted the r-band lightcurve of SN 2020bqj (in black) and the R/r/I-band lightcurves of the slow evolving and/or double-peaked SNe Ibn OGLE-2014-SN-131 (yellow), SN 2011hw (blue), iPTF13beo (orange) and SN 2005la (purple). Also shown is PTF11rfr (turquoise), a rapidly rising SN IIn with a peak plateau, but a slow decline (see Nyholm et al. 2020). The latest pre-discovery upper limits, where available, are indicated by triangles. While normal Type Ibn SNe have declined ∼4 mag 35−40 days after peak, SN 2020bqj stayed constant in brightness during the same period. SN 2011hw shows a similar lightcurve evolution, albeit one magnitude fainter. Phase is days in rest-frame since estimated explosion epoch for SN 2020bqj, SN 2011hw, iPTF13beo. The phases of SN 2005la, OGLE-2014-SN-131 and PTF11rfr are relative to their last non-detections, although for the two SNe Ibn these observations were rather shallow. The phase of the Type Ibn template is relative to the start of the template at 8 days before peak.
Current usage metrics show cumulative count of Article Views (full-text article views including HTML views, PDF and ePub downloads, according to the available data) and Abstracts Views on Vision4Press platform.
Data correspond to usage on the plateform after 2015. The current usage metrics is available 48-96 hours after online publication and is updated daily on week days.
Initial download of the metrics may take a while.