Free Access
Fig. 3.
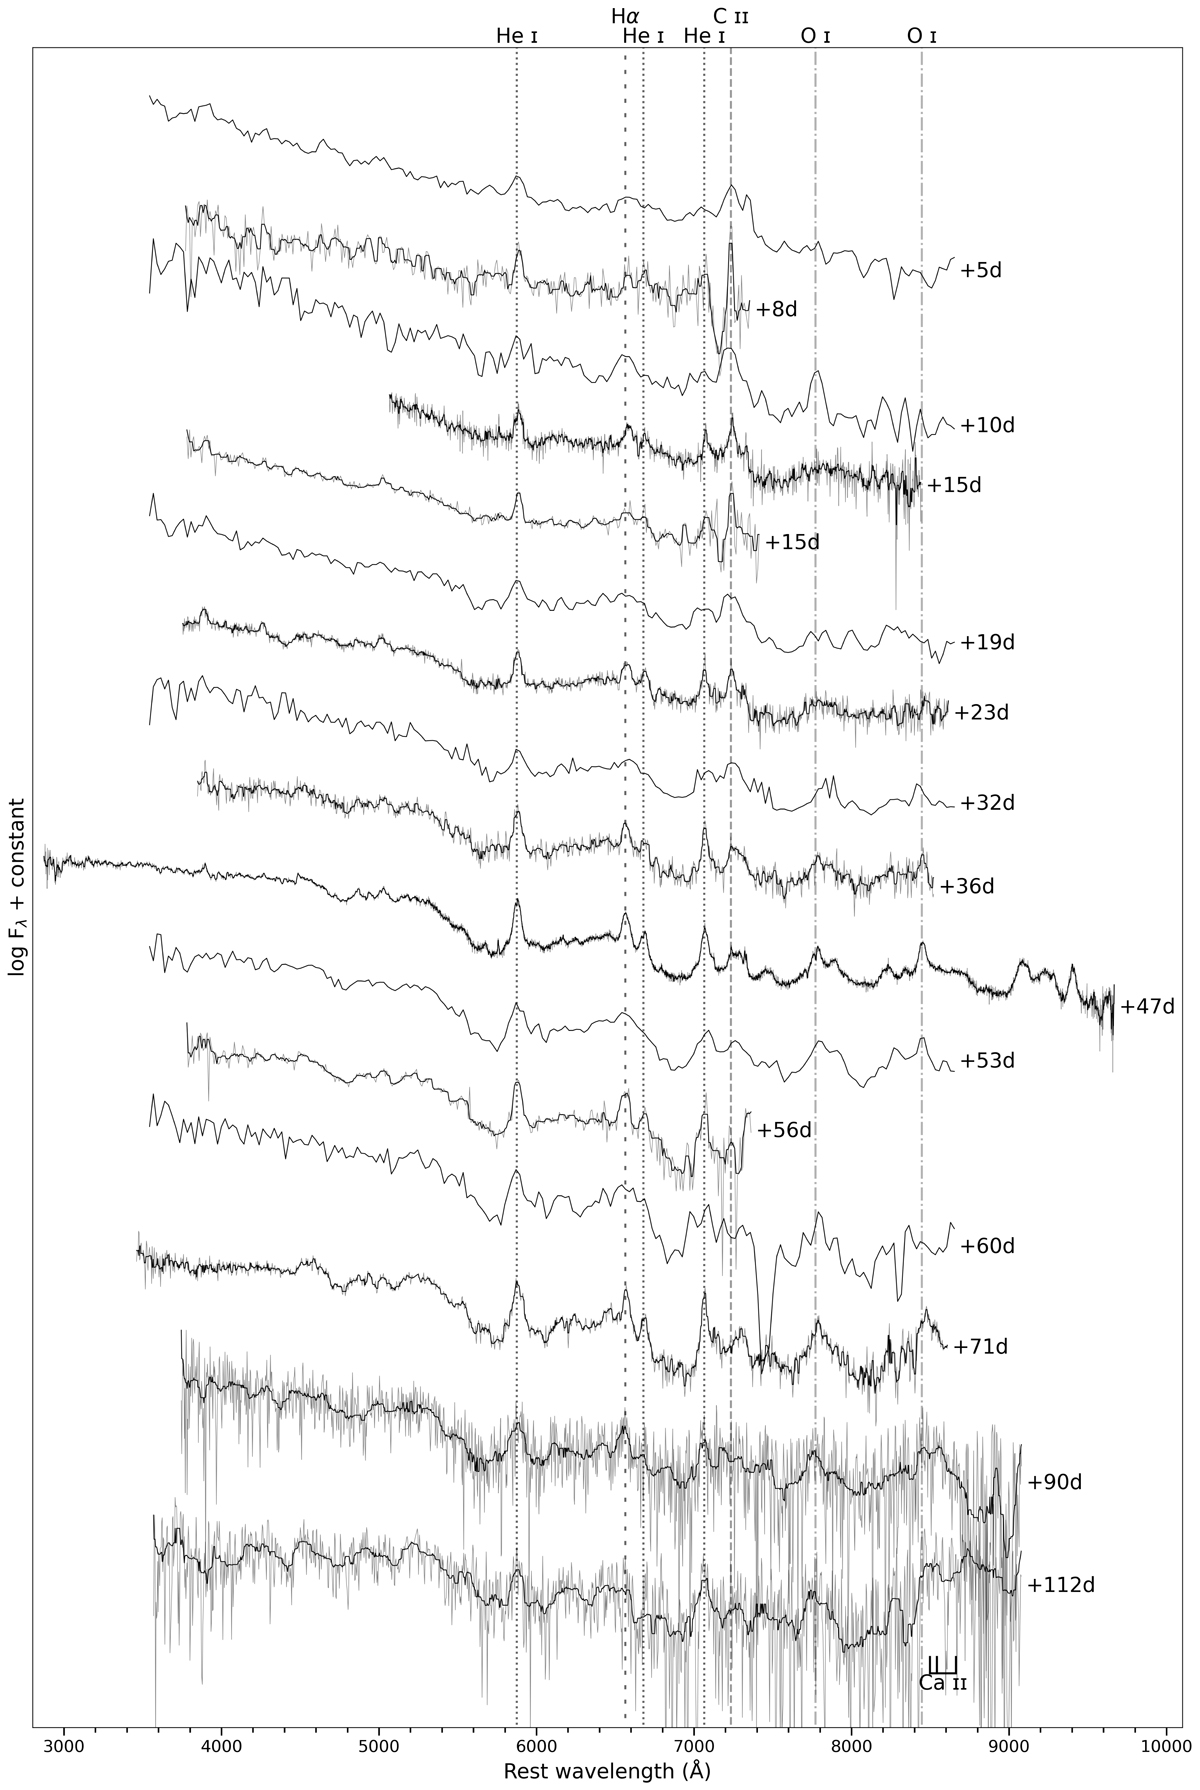
Spectral sequence of SN 2020bqj, see Table A.2. Phases are relative to the estimated explosion epoch, halfway between the last non-detection and the discovery epoch. Some spectra have been smoothed with a median filter for clarity. A selection of prominent emission lines are indicated.
Current usage metrics show cumulative count of Article Views (full-text article views including HTML views, PDF and ePub downloads, according to the available data) and Abstracts Views on Vision4Press platform.
Data correspond to usage on the plateform after 2015. The current usage metrics is available 48-96 hours after online publication and is updated daily on week days.
Initial download of the metrics may take a while.