Fig. 2.
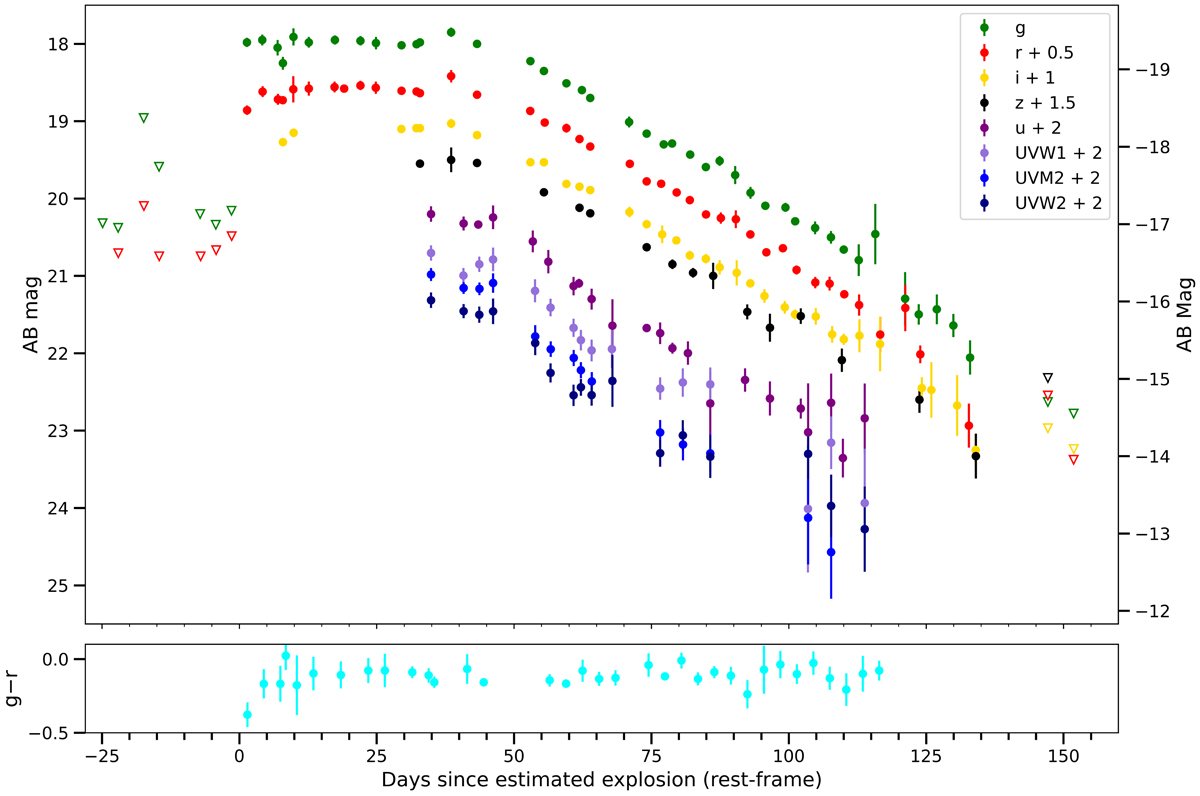
Lightcurves of SN 2020bqj, corrected for MW extinction. Non-detections with 5σ upper limits are indicated by triangles. Apparent magnitudes on the left hand axis and absolute magnitudes to the right. The photometry on the decline has been binned in three-night bins. Phase is rest-frame days since the estimated explosion epoch, which was assumed to fall halfway between latest non-detection and discovery epoch. SwiftB- and V-band data are not shown due to their large photometric uncertainties. Bottom panel: g − r color evolution, which stays roughly constant throughout the evolution of SN 2020bqj except for possibly the first ∼5 days.
Current usage metrics show cumulative count of Article Views (full-text article views including HTML views, PDF and ePub downloads, according to the available data) and Abstracts Views on Vision4Press platform.
Data correspond to usage on the plateform after 2015. The current usage metrics is available 48-96 hours after online publication and is updated daily on week days.
Initial download of the metrics may take a while.