Fig. 12.
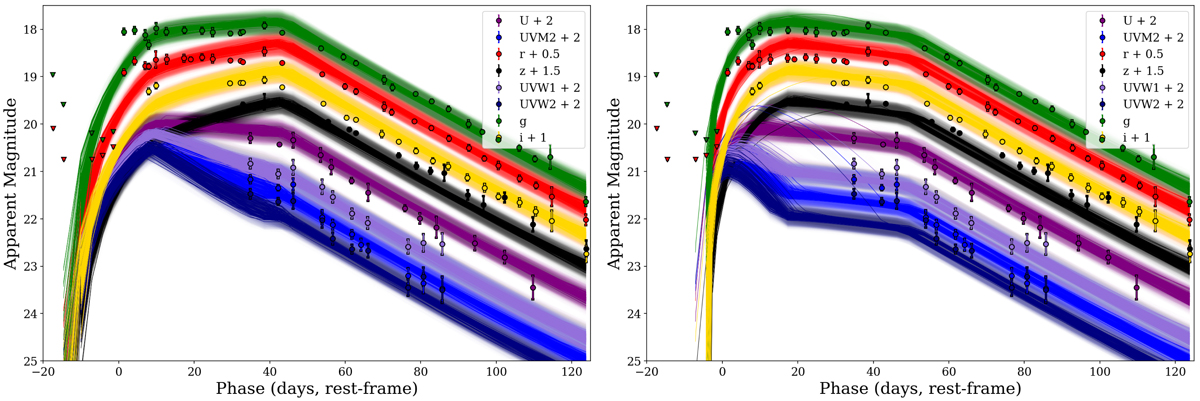
Ni+CSM model lightcurves fitted to the photometry of SN 2020bqj using the Monte-Carlo code MOSF IT, with on the left the shell model (s = 0) and on the right the wind model (s = 2). A selection of lightcurves based on a random draw from the posteriors are plotted, to demonstrate the range of the model fit in each filter. The models are able to reproduce the flat plateau in the optical bands as well as the steady decline phase of the UV/optical. The rapid rise to the peak plateau of SN 2020bqj is less well reproduced, especially when taking into account the upper limits.
Current usage metrics show cumulative count of Article Views (full-text article views including HTML views, PDF and ePub downloads, according to the available data) and Abstracts Views on Vision4Press platform.
Data correspond to usage on the plateform after 2015. The current usage metrics is available 48-96 hours after online publication and is updated daily on week days.
Initial download of the metrics may take a while.