Fig. 9
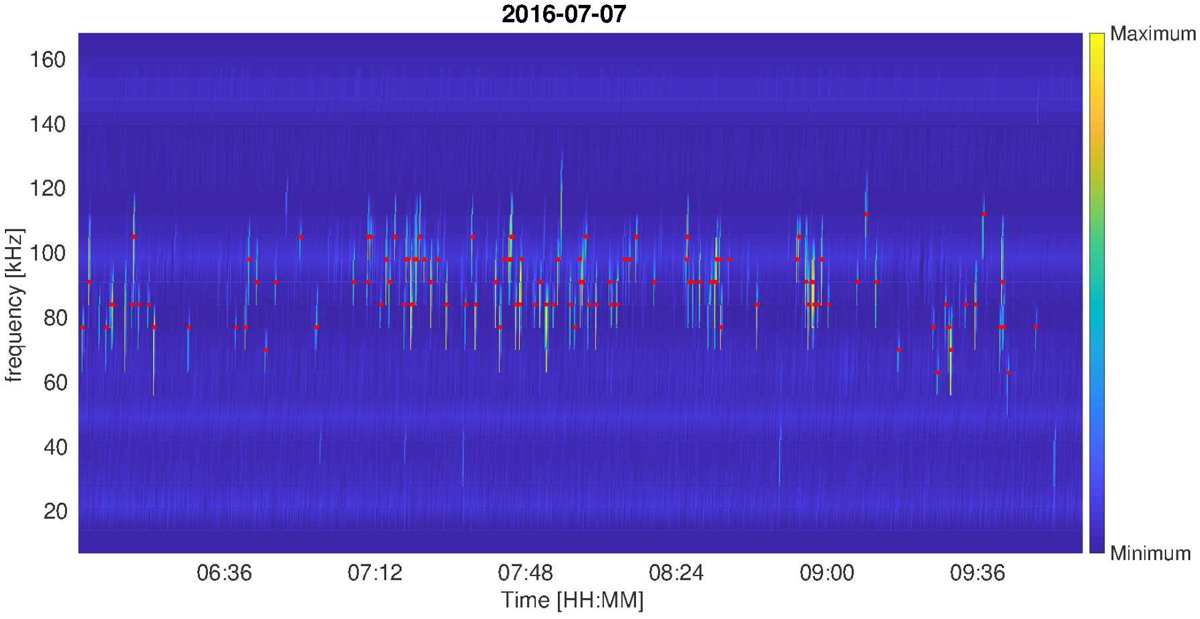
Example spectrogram showing electric field emissions measured by the RPC-MIP passive mode during the July 2016 SIR event studied by Hajra et al. (2018). The red dots indicate the frequency of electric field emissions identified at the plasma frequency. The spectrum has been normalized so that the color scale goes from minimum to maximum power amplitude.
Current usage metrics show cumulative count of Article Views (full-text article views including HTML views, PDF and ePub downloads, according to the available data) and Abstracts Views on Vision4Press platform.
Data correspond to usage on the plateform after 2015. The current usage metrics is available 48-96 hours after online publication and is updated daily on week days.
Initial download of the metrics may take a while.