Open Access
Fig. 8
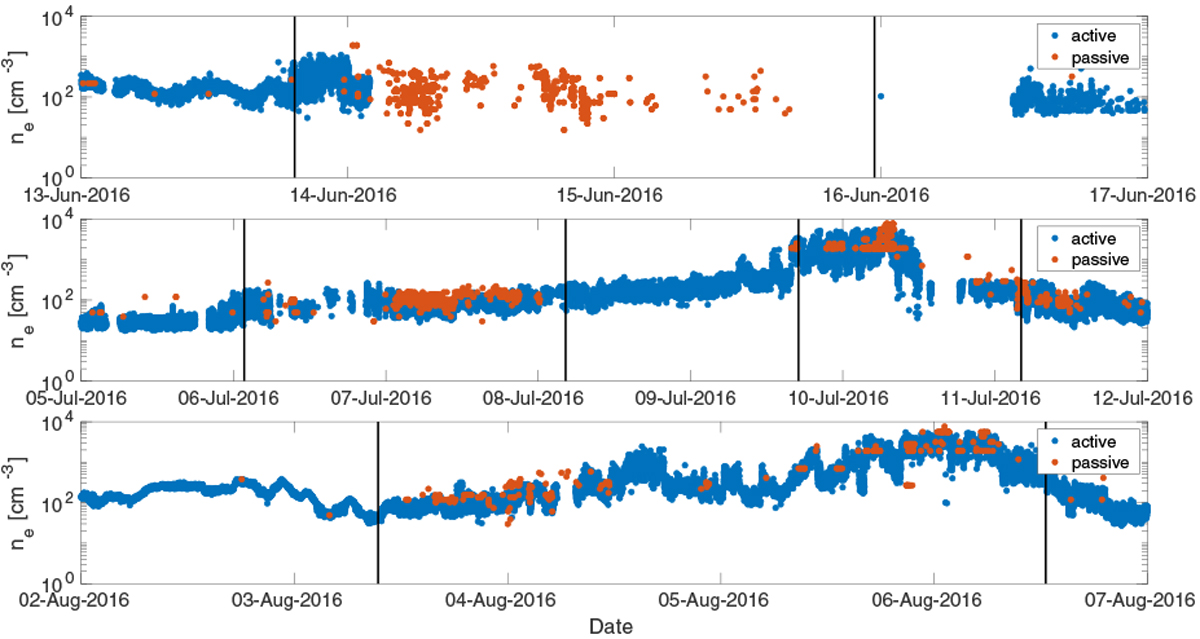
Three SIR intervals studied by Hajra et al. (2018). The blue dots show plasma density extracted from the RPC-MIP active measurements, while the red dots are from the RPC-MIP passive mode.
Current usage metrics show cumulative count of Article Views (full-text article views including HTML views, PDF and ePub downloads, according to the available data) and Abstracts Views on Vision4Press platform.
Data correspond to usage on the plateform after 2015. The current usage metrics is available 48-96 hours after online publication and is updated daily on week days.
Initial download of the metrics may take a while.