Fig. 3
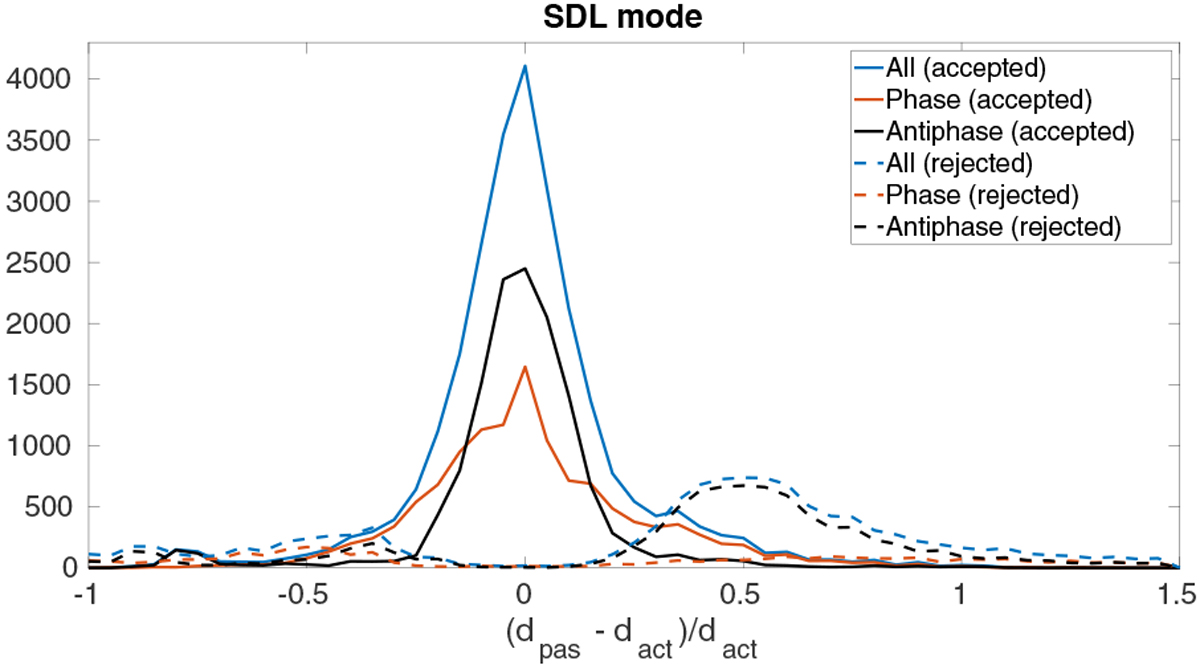
Relative error between the RPC-MIP active (dact) and passive (dpas) densities. The distributions indicated with solid lines show the relative difference when the difference between the RPC-MIP active and passive densities were smaller than the measurement uncertainties (accepted), while the dashed lines indicate times when the density difference was larger than the uncertainties (rejected).
Current usage metrics show cumulative count of Article Views (full-text article views including HTML views, PDF and ePub downloads, according to the available data) and Abstracts Views on Vision4Press platform.
Data correspond to usage on the plateform after 2015. The current usage metrics is available 48-96 hours after online publication and is updated daily on week days.
Initial download of the metrics may take a while.