Fig. 13
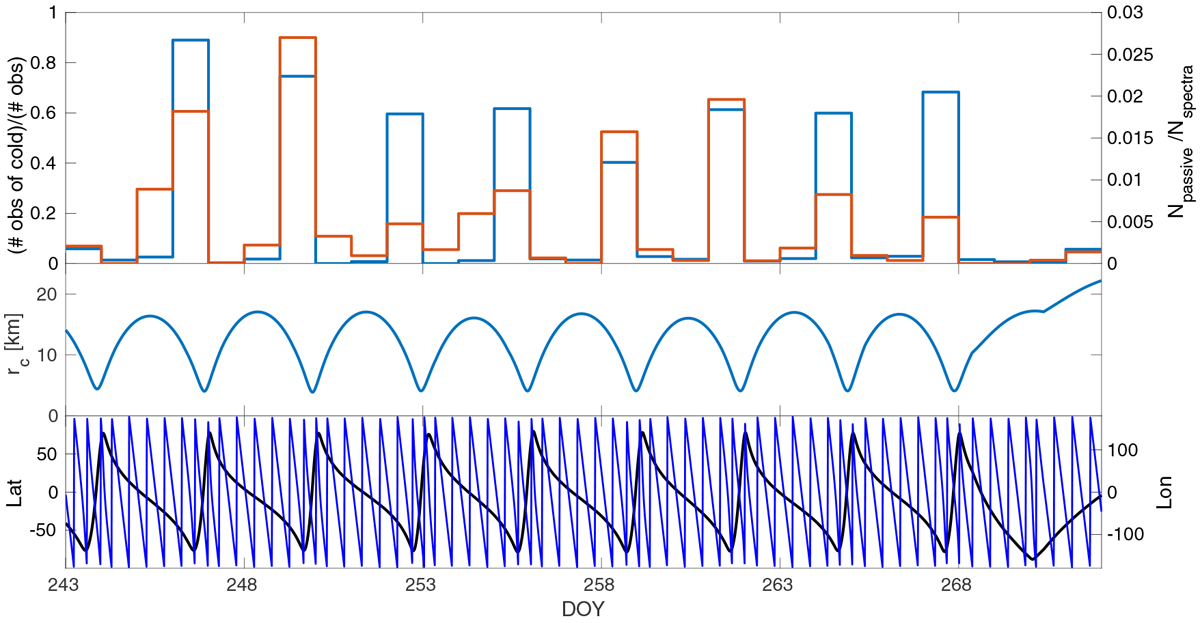
Upper panel: daily ratio of the number of RPC-MIP active spectra with cold electrons to all measured RPC-MIP active spectra (blue bars, left y-axis) and ratio of the number of RPC-MIP passive spectra with electric field emissions to all measured RPC-MIP passive spectra (red bars, right y-axis). The horizontal axis indicates the day of the year in 2016. Middle panel: cometocentric distance of Rosetta in km. Bottom panel: latitude (black line, left y-axis) and longitude (blue line, right y-axis) of Rosetta.
Current usage metrics show cumulative count of Article Views (full-text article views including HTML views, PDF and ePub downloads, according to the available data) and Abstracts Views on Vision4Press platform.
Data correspond to usage on the plateform after 2015. The current usage metrics is available 48-96 hours after online publication and is updated daily on week days.
Initial download of the metrics may take a while.