Fig. 11
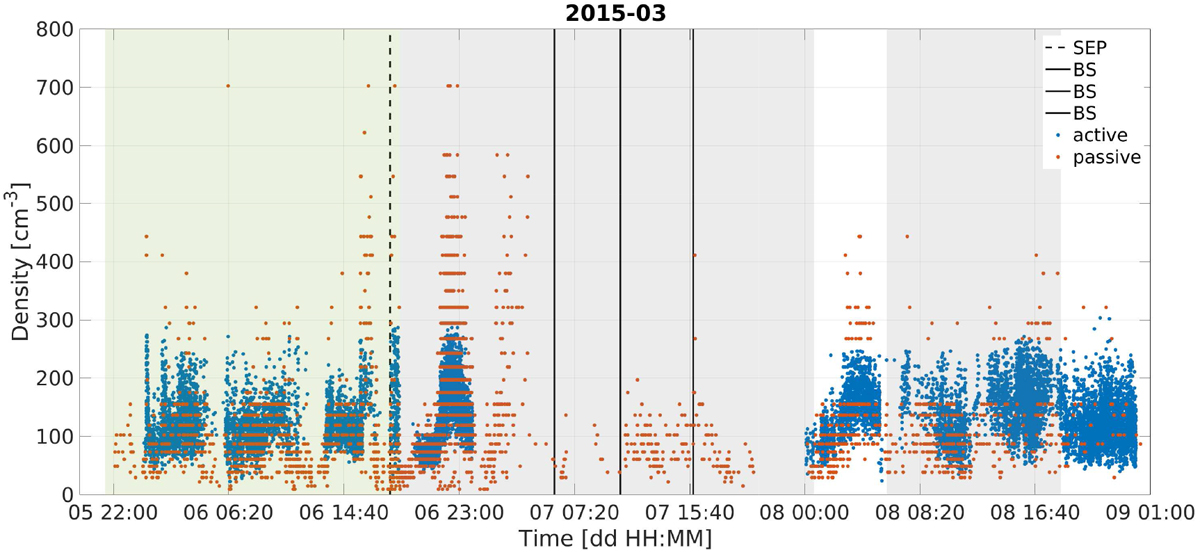
Cometary plasma density extracted from the RPC-MIP active (blue) and passive (red) modes during two interacting CMEs in March 2015. The CME sheath region is indicated with a green area, while the ejectas are marked in gray. The dashed line shows the beginning of the SEP event, while the infant bow shock locations given by Gunell et al. (2018) are indicated by solid lines.
Current usage metrics show cumulative count of Article Views (full-text article views including HTML views, PDF and ePub downloads, according to the available data) and Abstracts Views on Vision4Press platform.
Data correspond to usage on the plateform after 2015. The current usage metrics is available 48-96 hours after online publication and is updated daily on week days.
Initial download of the metrics may take a while.