Fig. 10
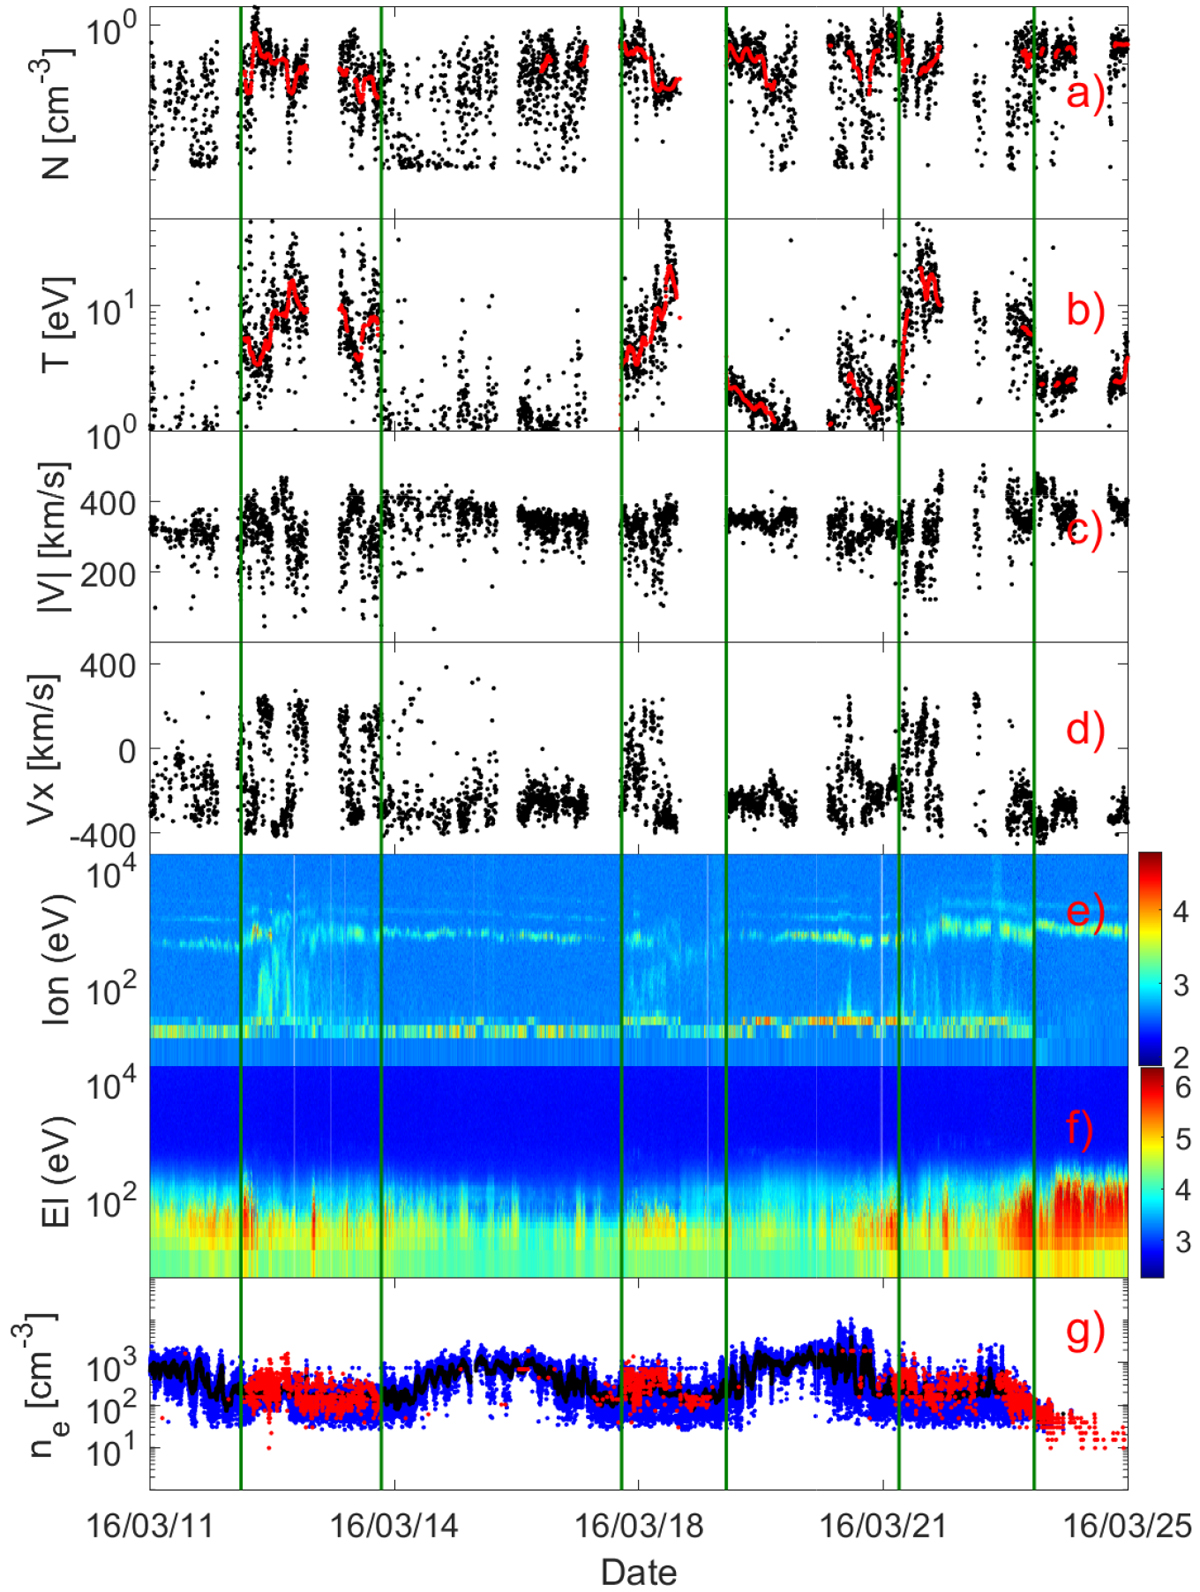
Three SIR events during March 2016 near comet 67P. The panels show, from top to bottom: solar wind proton density (log-scale), solar wind proton temperature (log-scale), solar wind proton speed, solar wind velocity component parallel to the Sun–comet line, ion counts (color bar is in log-scale showing the exponents for the counts), electron (El) counts, plasma density from RPC-MIP active (nonsmoothed as blue and moving median as black), and passive (red) modes as a function of time. In panels a and b, the black dots show nonsmoothed plasma densities and red points are 50-point moving median. In panel e, the signal near 1 keV is caused by solar wind protons while the signal below 100 eV shows the cometary ions. The green vertical lines delimit the SIR intervals. Time axis format is [YY/MM/DD].
Current usage metrics show cumulative count of Article Views (full-text article views including HTML views, PDF and ePub downloads, according to the available data) and Abstracts Views on Vision4Press platform.
Data correspond to usage on the plateform after 2015. The current usage metrics is available 48-96 hours after online publication and is updated daily on week days.
Initial download of the metrics may take a while.