Fig. 1
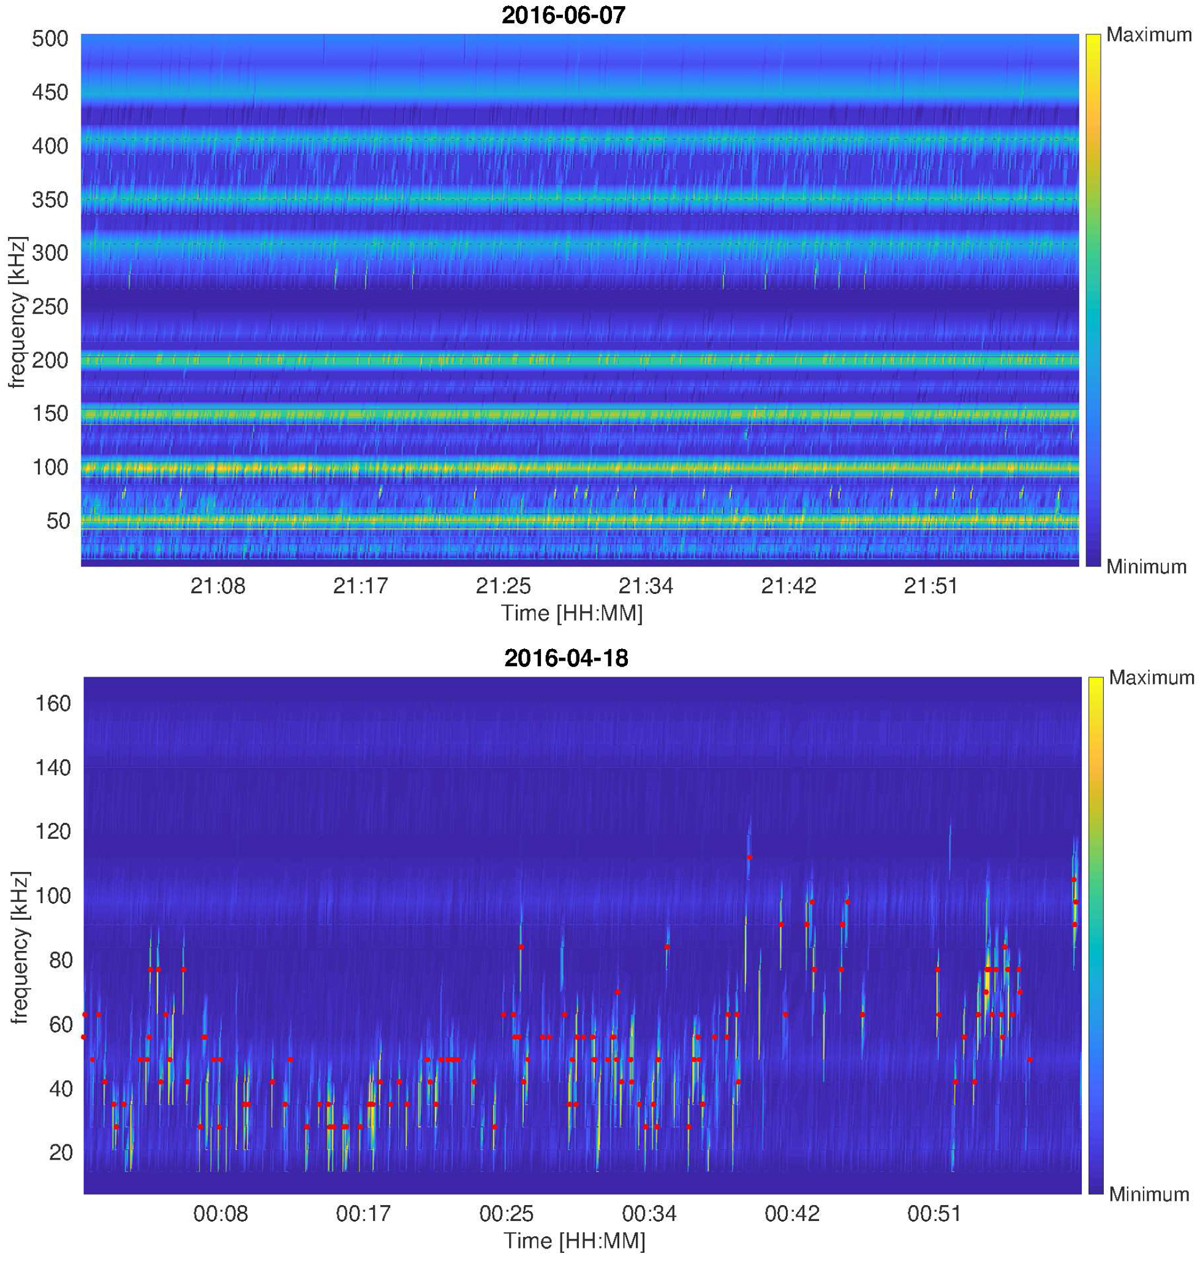
Examples of the RPC-MIP passive spectrograms. Upper panel: typical passive spectrogram that is characterized by multiple interferences. Lower panel: time interval featuring many strong electric field emissions. The red dots show the locations of the emissions identified by the search algorithm. The spectrograms have been normalized so that the color scales from minimum to maximum in order to ease the identification of interferences or electric field emissions in the spectrograms.
Current usage metrics show cumulative count of Article Views (full-text article views including HTML views, PDF and ePub downloads, according to the available data) and Abstracts Views on Vision4Press platform.
Data correspond to usage on the plateform after 2015. The current usage metrics is available 48-96 hours after online publication and is updated daily on week days.
Initial download of the metrics may take a while.