Fig. 6.
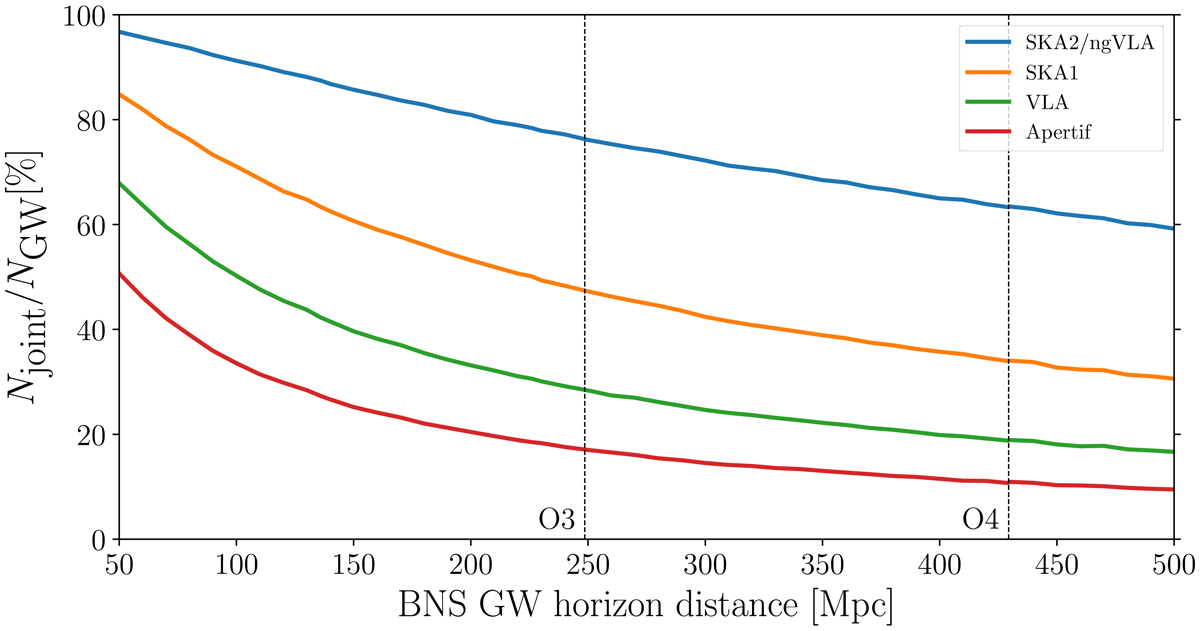
Fraction of BNS mergers that will be detectable both in GWs and through their radio afterglow (Njoint) vs. those only detectable in GWs (NGW). The mergers are simulated up to the horizon of aLIGO Hanford with the dashed vertical lines indicating the sensitivities in O3 and O4. SKA2 or ngVLA, SKA1, VLA, and Apertif are shown as the blue, orange, green, and red curves, respectively. During O4, Apertif will be able to detect ∼11% of the well-localised GW events.
Current usage metrics show cumulative count of Article Views (full-text article views including HTML views, PDF and ePub downloads, according to the available data) and Abstracts Views on Vision4Press platform.
Data correspond to usage on the plateform after 2015. The current usage metrics is available 48-96 hours after online publication and is updated daily on week days.
Initial download of the metrics may take a while.