Free Access
Fig. 5.
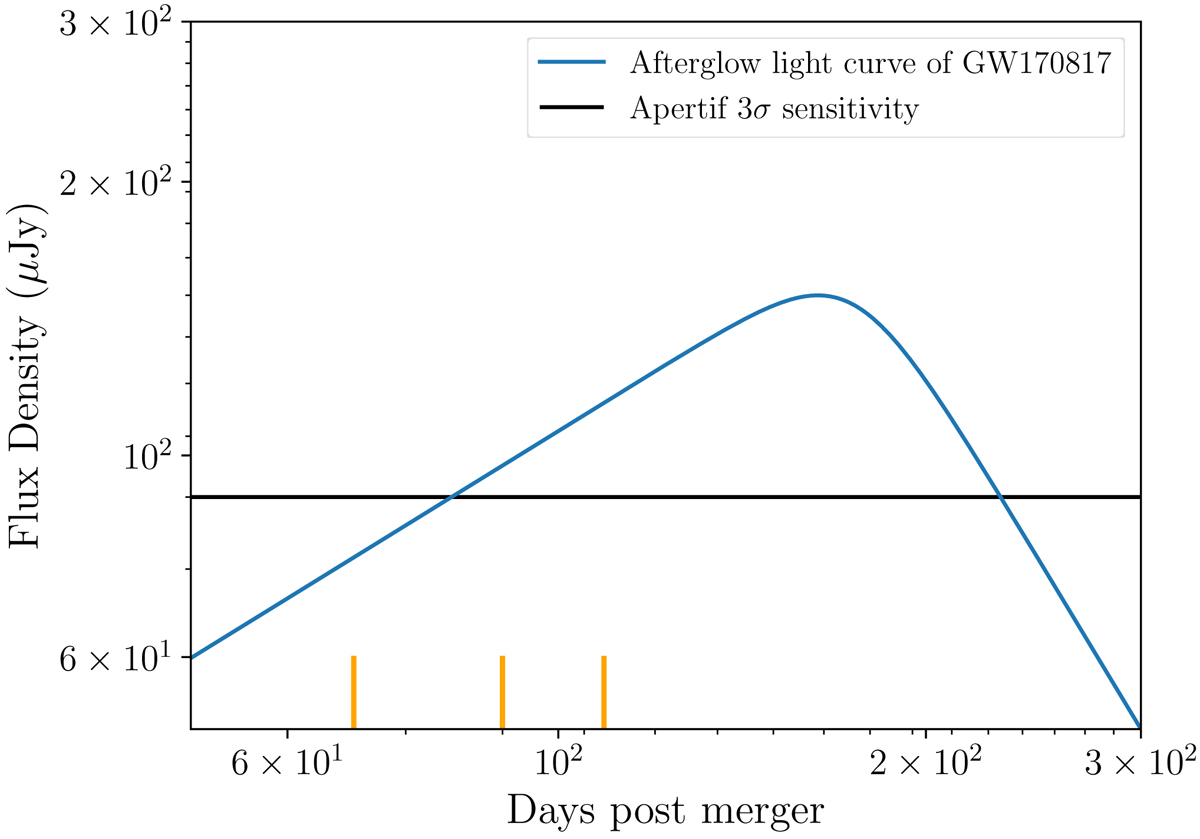
Fit to radio light curve of afterglow of GW170817 (Mooley et al. 2018a) in blue. The curve is plotted on a log-log scale to easily show the power-law dependence. The 3σ Apertif design sensitivity is shown in black. Three observations on the same days post merger as our observations for GW190425 are shown as orange stripes.
Current usage metrics show cumulative count of Article Views (full-text article views including HTML views, PDF and ePub downloads, according to the available data) and Abstracts Views on Vision4Press platform.
Data correspond to usage on the plateform after 2015. The current usage metrics is available 48-96 hours after online publication and is updated daily on week days.
Initial download of the metrics may take a while.