Free Access
Fig. 4.
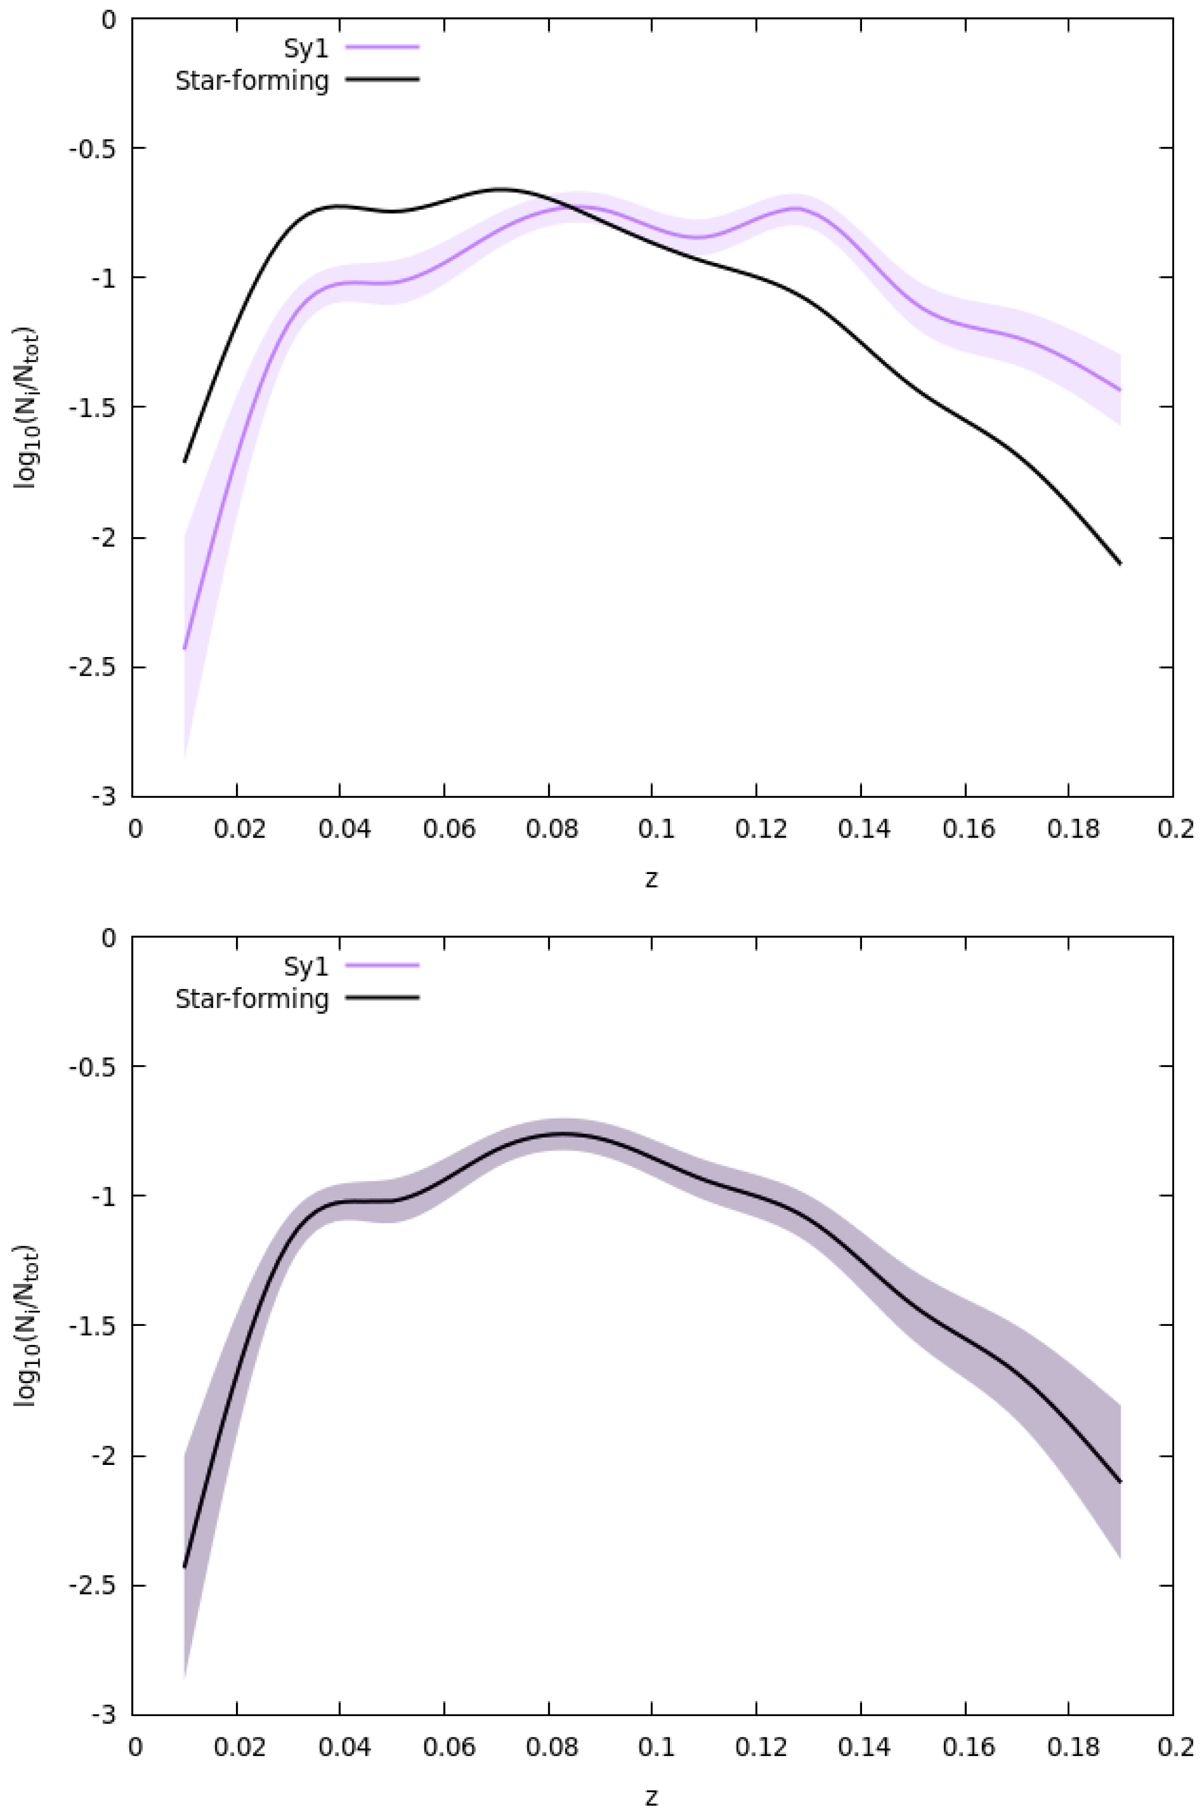
Upper panel: normalised redshift distribution of spiral Sy1 and SF galaxies. Lower panel: normalised redshift-matched distribution of Sy1s and the corresponding SF control sample. The Sy1 and the SF sub-samples are colour-coded as in Fig. 1, while the shaded area corresponds to the 1σ Poisson uncertainty.
Current usage metrics show cumulative count of Article Views (full-text article views including HTML views, PDF and ePub downloads, according to the available data) and Abstracts Views on Vision4Press platform.
Data correspond to usage on the plateform after 2015. The current usage metrics is available 48-96 hours after online publication and is updated daily on week days.
Initial download of the metrics may take a while.