Fig. 4.
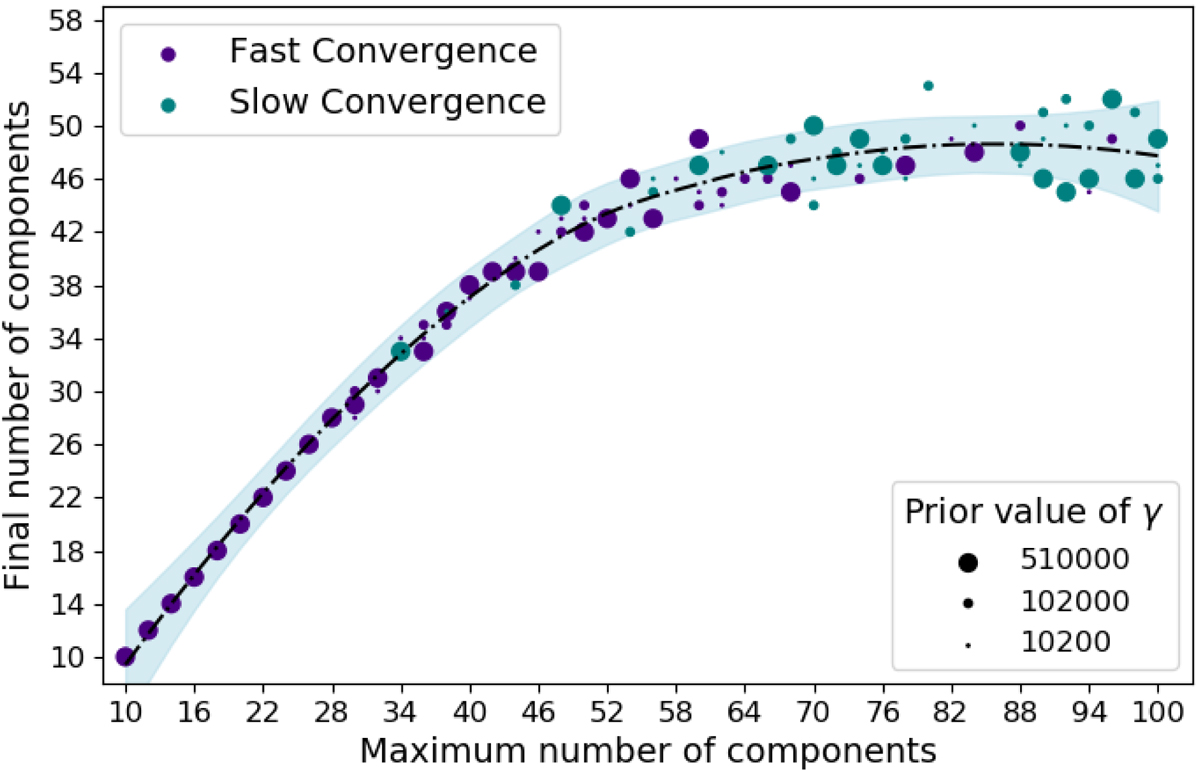
Maximum number of components vs. final number of components for different IGMM realisations, restricted to Gaussian components that contain at least 0.5% of the photometric data. Blue filled circles represent IGMM realisations that needed more than 2000 iterations to converge, while purple filled circles mark IGMM realisations that needed less than 2000 iterations. The size of the symbols scales with three different values of the prior of the Dirichlet concentration (γ). The light blue shaded region represents the confidence interval of 99% of regression estimation over the IGMM profiles by a multivariate smoothing procedure.
Current usage metrics show cumulative count of Article Views (full-text article views including HTML views, PDF and ePub downloads, according to the available data) and Abstracts Views on Vision4Press platform.
Data correspond to usage on the plateform after 2015. The current usage metrics is available 48-96 hours after online publication and is updated daily on week days.
Initial download of the metrics may take a while.