Free Access
Fig. 11.
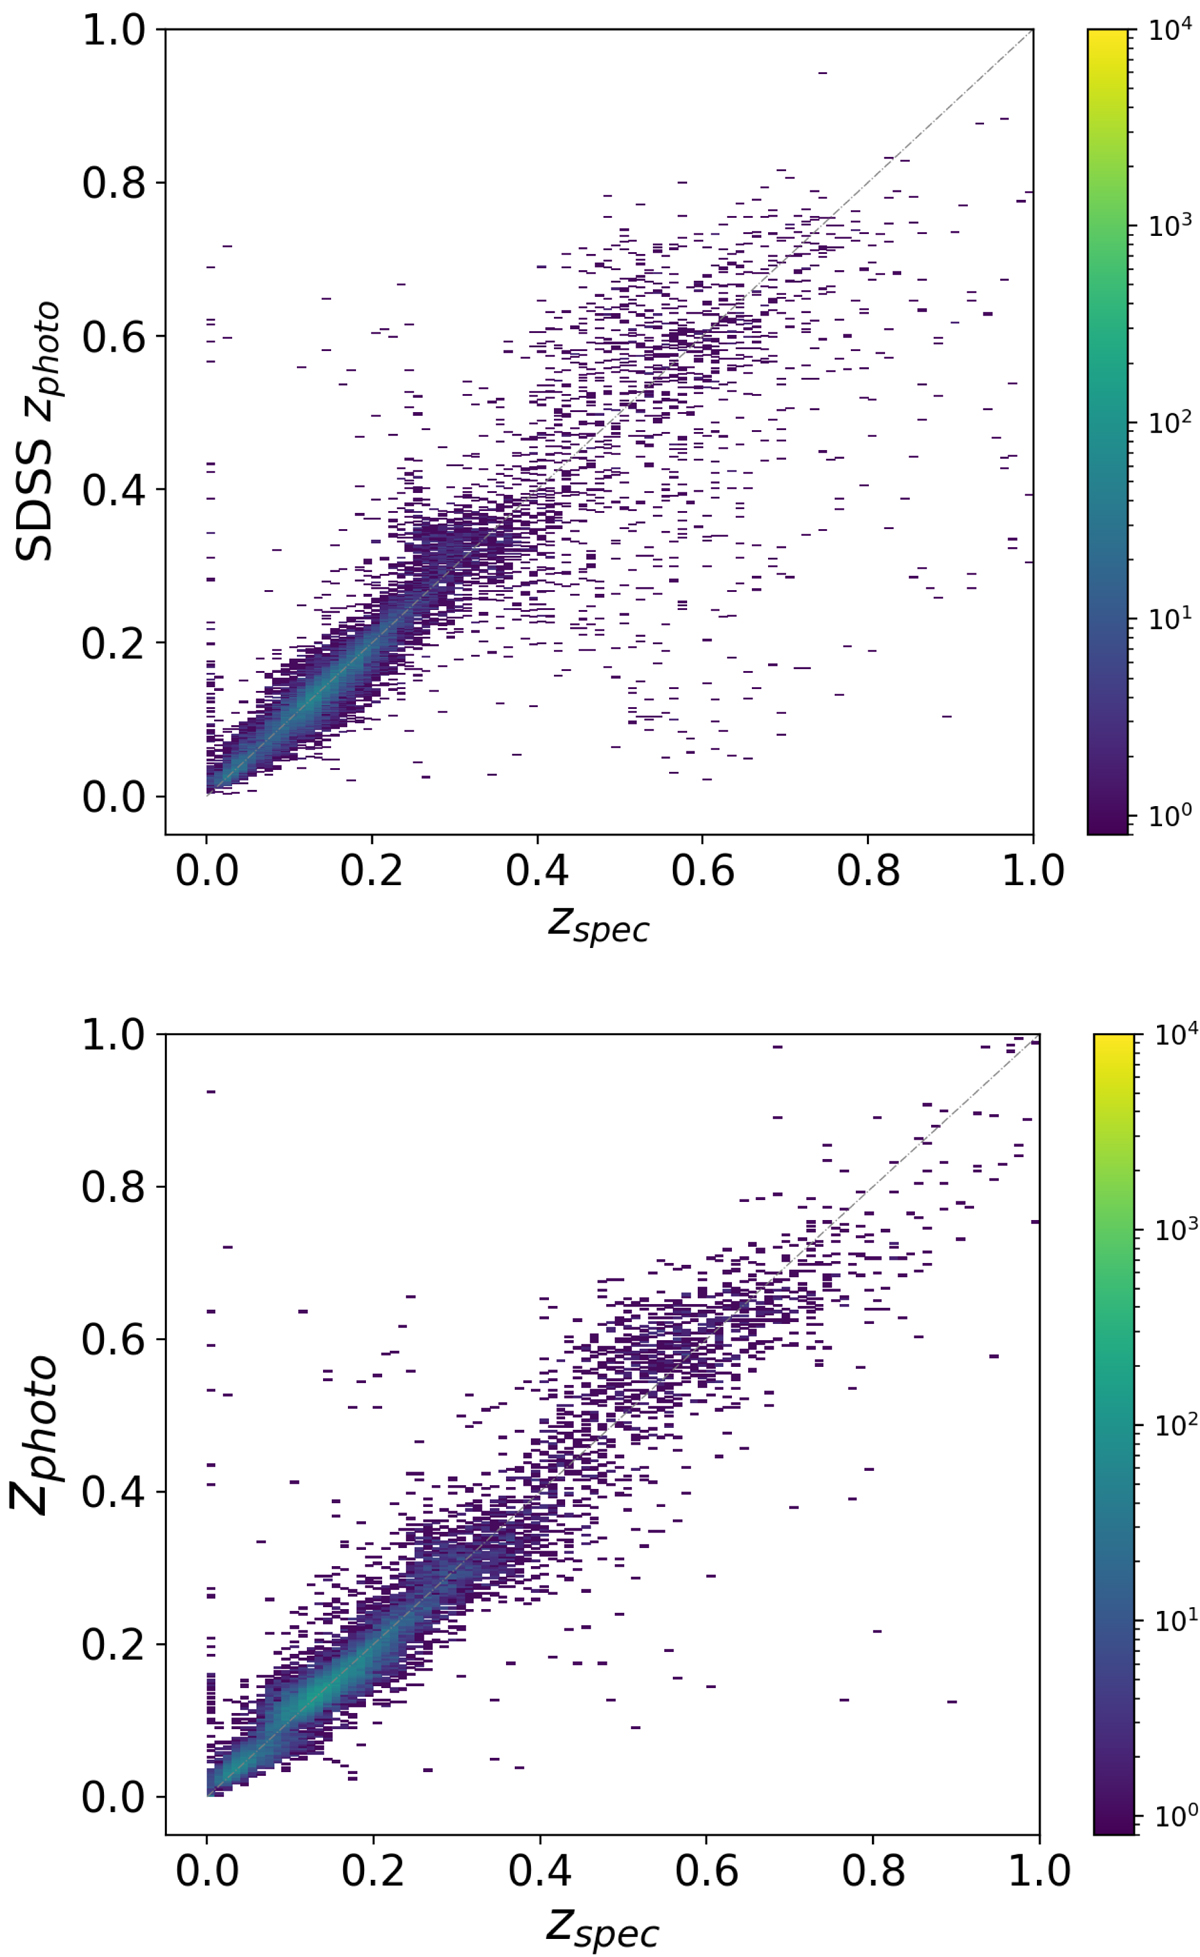
Top panel: SDSS spectroscopic redshift vs. SDSS photometric redshift. Bottom panel: spectroscopic redshift vs. photometric redshift (this work). Colour bars indicate the number of sources in the diagrams. The selection of sources is made by retaining objects with weightmax > 0.8 membership probability to a MDN branch.
Current usage metrics show cumulative count of Article Views (full-text article views including HTML views, PDF and ePub downloads, according to the available data) and Abstracts Views on Vision4Press platform.
Data correspond to usage on the plateform after 2015. The current usage metrics is available 48-96 hours after online publication and is updated daily on week days.
Initial download of the metrics may take a while.